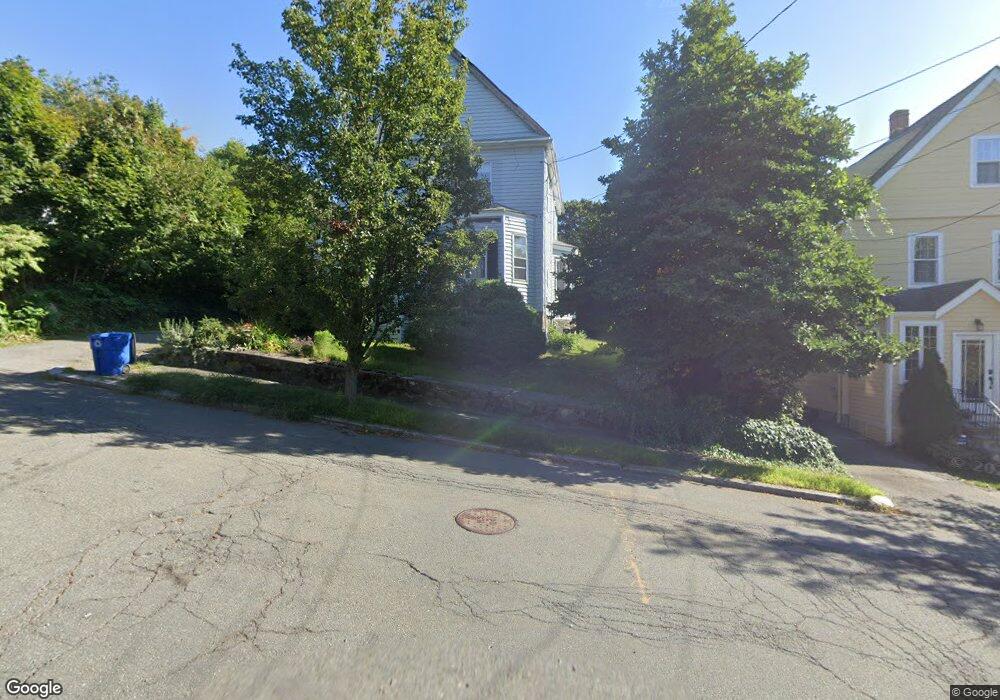
49 Appleton St Melrose, MA 02176
Melrose East Side NeighborhoodEstimated Value: $797,000 - $1,035,000
3
Beds
2
Baths
1,816
Sq Ft
$483/Sq Ft
Est. Value
About This Home
This home is located at 49 Appleton St, Melrose, MA 02176 and is currently estimated at $876,320, approximately $482 per square foot. 49 Appleton St is a home located in Middlesex County with nearby schools including Hoover Elementary School, Lincoln Elementary School, and Winthrop Elementary School.
Ownership History
Date
Name
Owned For
Owner Type
Purchase Details
Closed on
Apr 29, 1998
Sold by
Cook Robert E and Cook Gayle M
Bought by
Poravas Christopher and Poravas Cleo
Current Estimated Value
Purchase Details
Closed on
Sep 9, 1987
Sold by
Neil Clarence T Est
Bought by
Cook Robt E
Create a Home Valuation Report for This Property
The Home Valuation Report is an in-depth analysis detailing your home's value as well as a comparison with similar homes in the area
Home Values in the Area
Average Home Value in this Area
Purchase History
| Date | Buyer | Sale Price | Title Company |
|---|---|---|---|
| Poravas Christopher | $163,000 | -- | |
| Cook Robt E | $135,000 | -- |
Source: Public Records
Mortgage History
| Date | Status | Borrower | Loan Amount |
|---|---|---|---|
| Open | Cook Robt E | $30,000 | |
| Closed | Cook Robt E | $25,000 | |
| Open | Cook Robt E | $160,000 |
Source: Public Records
Tax History
| Year | Tax Paid | Tax Assessment Tax Assessment Total Assessment is a certain percentage of the fair market value that is determined by local assessors to be the total taxable value of land and additions on the property. | Land | Improvement |
|---|---|---|---|---|
| 2025 | $68 | $683,800 | $418,500 | $265,300 |
| 2024 | $6,481 | $652,700 | $393,100 | $259,600 |
| 2023 | $6,490 | $622,800 | $380,400 | $242,400 |
| 2022 | $6,492 | $614,200 | $380,400 | $233,800 |
| 2021 | $6,267 | $572,300 | $355,100 | $217,200 |
| 2020 | $5,904 | $534,300 | $317,000 | $217,300 |
| 2019 | $5,329 | $493,000 | $292,900 | $200,100 |
| 2018 | $5,284 | $466,400 | $266,300 | $200,100 |
| 2017 | $5,133 | $435,000 | $253,600 | $181,400 |
| 2016 | $5,004 | $405,800 | $247,300 | $158,500 |
| 2015 | $4,819 | $371,800 | $221,900 | $149,900 |
| 2014 | $4,602 | $346,500 | $196,600 | $149,900 |
Source: Public Records
Map
Nearby Homes
- 0 Beech Ave
- 31 Temple St
- 65 Beacon St
- 77 Lynde St
- 30 Wheeler Ave
- 0 S Mountain Avenue & O Cargil
- 70 Sylvan St
- 333 Main St
- 187 Laurel St
- 3 Hunnewell St
- 340 Main St Unit 508
- 340 Main St Unit 206
- 244 Main St
- 236-238 Main St
- 1 Mill Rd
- 447 Pleasant St
- 515 Pleasant St Unit 1-1
- 509 Pleasant St Unit 1-4
- 445 E Foster St
- 20 Huntley St
Your Personal Tour Guide
Ask me questions while you tour the home.