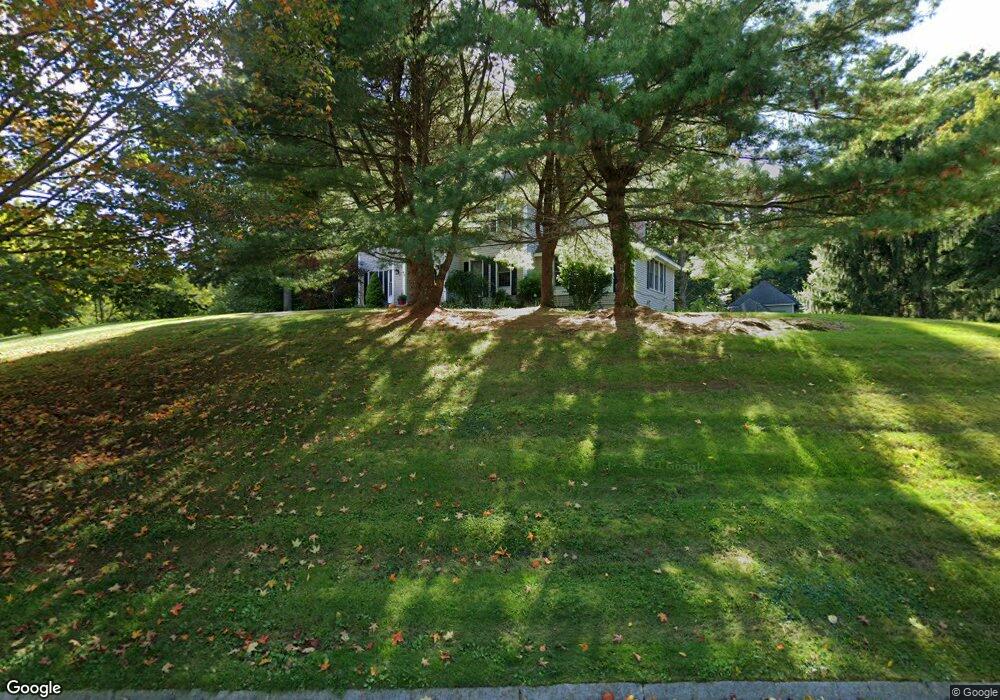
49 Arrowwood St Methuen, MA 01844
The West End NeighborhoodEstimated Value: $837,170 - $982,000
4
Beds
3
Baths
2,661
Sq Ft
$343/Sq Ft
Est. Value
About This Home
This home is located at 49 Arrowwood St, Methuen, MA 01844 and is currently estimated at $912,293, approximately $342 per square foot. 49 Arrowwood St is a home located in Essex County with nearby schools including Marsh Grammar School, South Point Elementary School, and Methuen High School.
Ownership History
Date
Name
Owned For
Owner Type
Purchase Details
Closed on
Jun 18, 2010
Sold by
Kushner Robert S and Kushner Marie A
Bought by
Gradzewicz Andrew M and Gradzewicz Margaret E
Current Estimated Value
Purchase Details
Closed on
Jan 31, 2001
Sold by
Kelley Celeste E
Bought by
Kushner Robert S and Kushner Marie A
Purchase Details
Closed on
Jul 10, 1998
Sold by
Cochran Steven L
Bought by
Kelley Celeste E
Purchase Details
Closed on
Aug 12, 1994
Sold by
Alcro Lp
Bought by
Cochran Steven L
Create a Home Valuation Report for This Property
The Home Valuation Report is an in-depth analysis detailing your home's value as well as a comparison with similar homes in the area
Home Values in the Area
Average Home Value in this Area
Purchase History
| Date | Buyer | Sale Price | Title Company |
|---|---|---|---|
| Gradzewicz Andrew M | $479,500 | -- | |
| Kushner Robert S | $400,000 | -- | |
| Kelley Celeste E | $285,000 | -- | |
| Cochran Steven L | $251,524 | -- |
Source: Public Records
Mortgage History
| Date | Status | Borrower | Loan Amount |
|---|---|---|---|
| Open | Cochran Steven L | $376,000 | |
| Closed | Cochran Steven L | $300,000 |
Source: Public Records
Tax History Compared to Growth
Tax History
| Year | Tax Paid | Tax Assessment Tax Assessment Total Assessment is a certain percentage of the fair market value that is determined by local assessors to be the total taxable value of land and additions on the property. | Land | Improvement |
|---|---|---|---|---|
| 2025 | $7,997 | $755,900 | $309,900 | $446,000 |
| 2024 | $7,865 | $724,200 | $272,700 | $451,500 |
| 2023 | $7,532 | $643,800 | $241,400 | $402,400 |
| 2022 | $7,612 | $583,300 | $220,700 | $362,600 |
| 2021 | $7,173 | $543,800 | $210,300 | $333,500 |
| 2020 | $7,112 | $529,200 | $210,300 | $318,900 |
| 2019 | $7,037 | $495,900 | $200,000 | $295,900 |
| 2018 | $6,677 | $480,700 | $199,900 | $280,800 |
| 2017 | $6,676 | $455,700 | $199,900 | $255,800 |
| 2016 | $6,673 | $450,600 | $199,900 | $250,700 |
| 2015 | $6,433 | $440,600 | $199,900 | $240,700 |
Source: Public Records
Map
Nearby Homes