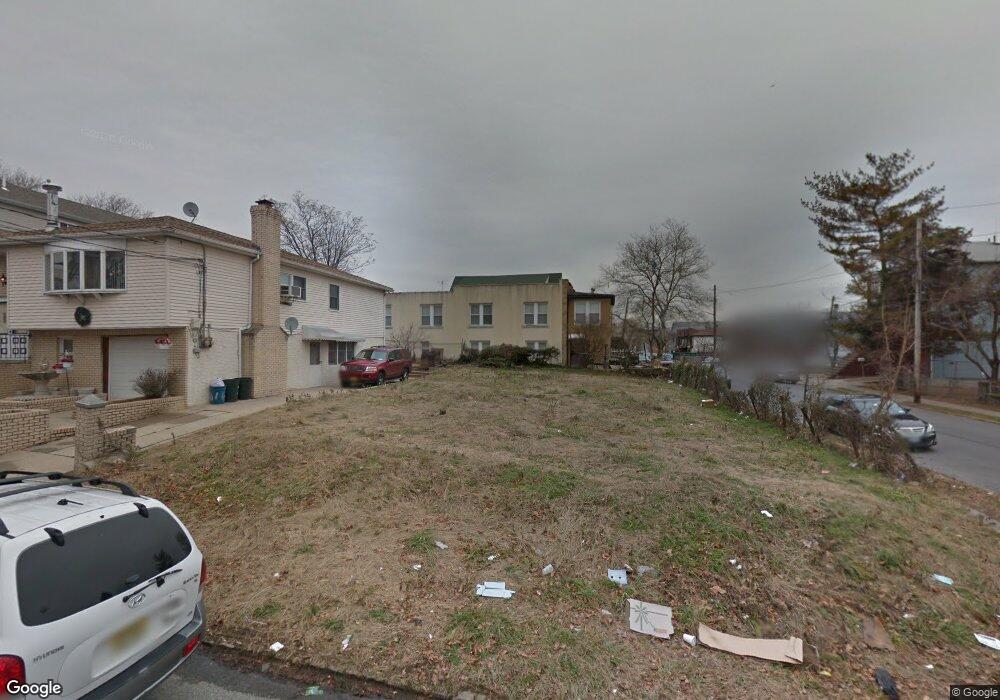
49 Arthur Ave Staten Island, NY 10305
South Beach NeighborhoodEstimated Value: $581,000 - $747,000
--
Bed
4
Baths
1,011
Sq Ft
$672/Sq Ft
Est. Value
About This Home
This home is located at 49 Arthur Ave, Staten Island, NY 10305 and is currently estimated at $679,397, approximately $672 per square foot. 49 Arthur Ave is a home located in Richmond County with nearby schools including P.S. 39 The Francis J. Murphy Jr. School, I.S. 49 Berta A Dreyfus, and Curtis High School.
Ownership History
Date
Name
Owned For
Owner Type
Purchase Details
Closed on
Mar 5, 2015
Sold by
L E L V Realty Inc
Bought by
Ameno Michael
Current Estimated Value
Purchase Details
Closed on
Apr 28, 2011
Sold by
L E L V Realty Inc
Bought by
Ameno Michael
Purchase Details
Closed on
Mar 15, 1995
Sold by
Briante Claudio and Briante Anna Maria
Bought by
L E L V Realty Inc
Create a Home Valuation Report for This Property
The Home Valuation Report is an in-depth analysis detailing your home's value as well as a comparison with similar homes in the area
Home Values in the Area
Average Home Value in this Area
Purchase History
| Date | Buyer | Sale Price | Title Company |
|---|---|---|---|
| Ameno Michael | -- | None Available | |
| Ameno Michael | $27,500 | None Available | |
| L E L V Realty Inc | $8,500 | First American Title Ins Co |
Source: Public Records
Tax History Compared to Growth
Tax History
| Year | Tax Paid | Tax Assessment Tax Assessment Total Assessment is a certain percentage of the fair market value that is determined by local assessors to be the total taxable value of land and additions on the property. | Land | Improvement |
|---|---|---|---|---|
| 2025 | $4,488 | $40,260 | $4,196 | $36,064 |
| 2024 | $4,488 | $36,540 | $4,623 | $31,917 |
| 2023 | $4,504 | $22,179 | $3,881 | $18,298 |
| 2022 | $4,177 | $43,560 | $7,560 | $36,000 |
| 2021 | $4,154 | $40,200 | $7,560 | $32,640 |
| 2020 | $3,942 | $39,720 | $7,560 | $32,160 |
| 2019 | $3,896 | $38,340 | $7,560 | $30,780 |
| 2018 | $3,796 | $18,622 | $5,134 | $13,488 |
| 2017 | $3,606 | $17,689 | $4,931 | $12,758 |
| 2016 | $3,336 | $16,688 | $6,277 | $10,411 |
| 2015 | $1,108 | $27,118 | $6,118 | $21,000 |
| 2014 | $1,108 | $5,772 | $5,772 | $0 |
Source: Public Records
Map
Nearby Homes