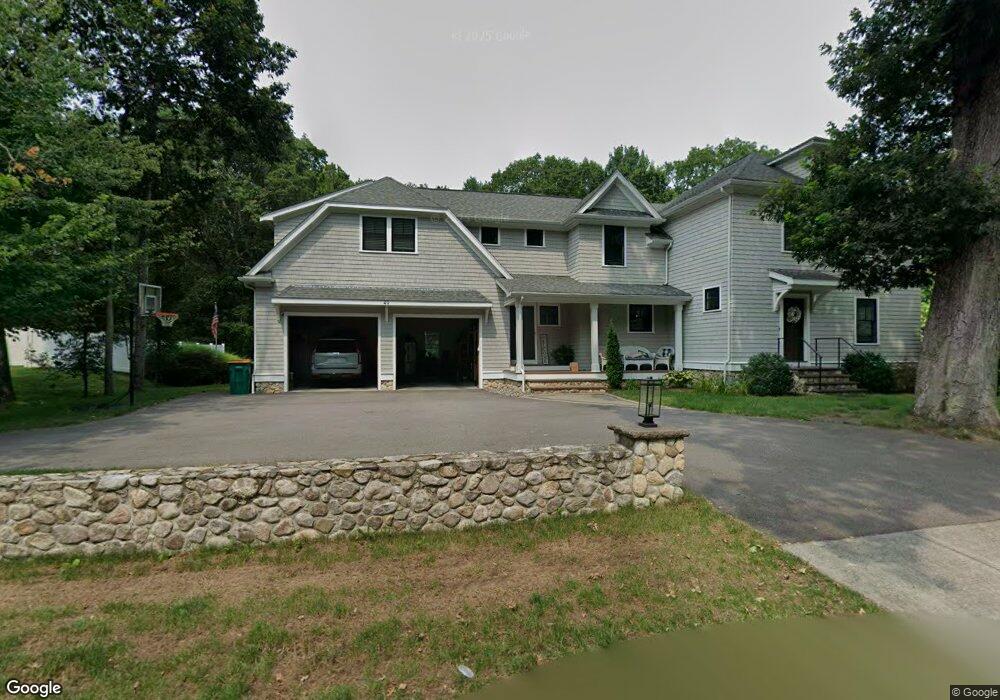
49 Balcom St Mansfield, MA 02048
Estimated Value: $662,000 - $1,155,000
3
Beds
2
Baths
1,467
Sq Ft
$606/Sq Ft
Est. Value
About This Home
This home is located at 49 Balcom St, Mansfield, MA 02048 and is currently estimated at $889,270, approximately $606 per square foot. 49 Balcom St is a home located in Bristol County with nearby schools including Everett W. Robinson Elementary School, Jordan/Jackson Elementary School, and Harold L. Qualters Middle School.
Ownership History
Date
Name
Owned For
Owner Type
Purchase Details
Closed on
Nov 7, 2018
Sold by
Canty Lauren and Parker Mark D
Bought by
Parker Mark D and Parker Lauren
Current Estimated Value
Home Financials for this Owner
Home Financials are based on the most recent Mortgage that was taken out on this home.
Original Mortgage
$290,000
Outstanding Balance
$106,913
Interest Rate
4.7%
Mortgage Type
New Conventional
Estimated Equity
$782,357
Purchase Details
Closed on
Jan 8, 2010
Sold by
Cuneo Gregory S and Cuneo Susan E
Bought by
Parker Mark D and Canty Lauren
Home Financials for this Owner
Home Financials are based on the most recent Mortgage that was taken out on this home.
Original Mortgage
$260,101
Interest Rate
4.78%
Mortgage Type
Purchase Money Mortgage
Create a Home Valuation Report for This Property
The Home Valuation Report is an in-depth analysis detailing your home's value as well as a comparison with similar homes in the area
Home Values in the Area
Average Home Value in this Area
Purchase History
| Date | Buyer | Sale Price | Title Company |
|---|---|---|---|
| Parker Mark D | -- | -- | |
| Parker Mark D | $264,900 | -- |
Source: Public Records
Mortgage History
| Date | Status | Borrower | Loan Amount |
|---|---|---|---|
| Open | Parker Mark D | $290,000 | |
| Previous Owner | Parker Mark D | $260,101 |
Source: Public Records
Tax History Compared to Growth
Tax History
| Year | Tax Paid | Tax Assessment Tax Assessment Total Assessment is a certain percentage of the fair market value that is determined by local assessors to be the total taxable value of land and additions on the property. | Land | Improvement |
|---|---|---|---|---|
| 2025 | $10,215 | $775,600 | $233,500 | $542,100 |
| 2024 | $10,041 | $743,800 | $233,500 | $510,300 |
| 2023 | $9,584 | $680,200 | $233,500 | $446,700 |
| 2022 | $9,458 | $623,500 | $216,200 | $407,300 |
| 2021 | $8,101 | $527,400 | $189,200 | $338,200 |
| 2020 | $5,560 | $362,000 | $180,200 | $181,800 |
| 2019 | $5,076 | $333,500 | $150,100 | $183,400 |
| 2018 | $4,631 | $318,800 | $143,100 | $175,700 |
| 2017 | $4,506 | $300,000 | $138,900 | $161,100 |
| 2016 | $4,256 | $276,200 | $132,200 | $144,000 |
| 2015 | $4,087 | $263,700 | $132,200 | $131,500 |
Source: Public Records
Map
Nearby Homes
- 4 Buckskin Dr
- 176 Elm St
- 2 Oak St Unit 2D
- 2 Oak St Unit 2A
- 2 Oak St Unit 2C
- 2 Oak St Unit 2B
- 150 Gilbert St
- 37 Oakleaf Dr
- 451R Gilbert St
- 255 Mckeon Dr
- 24 Maverick Dr
- 231 Spring St
- 250 Mansfield Ave Unit 66
- 14 Country Club Way
- 450 West St
- 15 Reservoir St Unit 44
- 196 Donald Tennant Cir
- 18 Columbine Rd
- 157 Mansfield Ave Unit 14
- 115 Westfield Dr