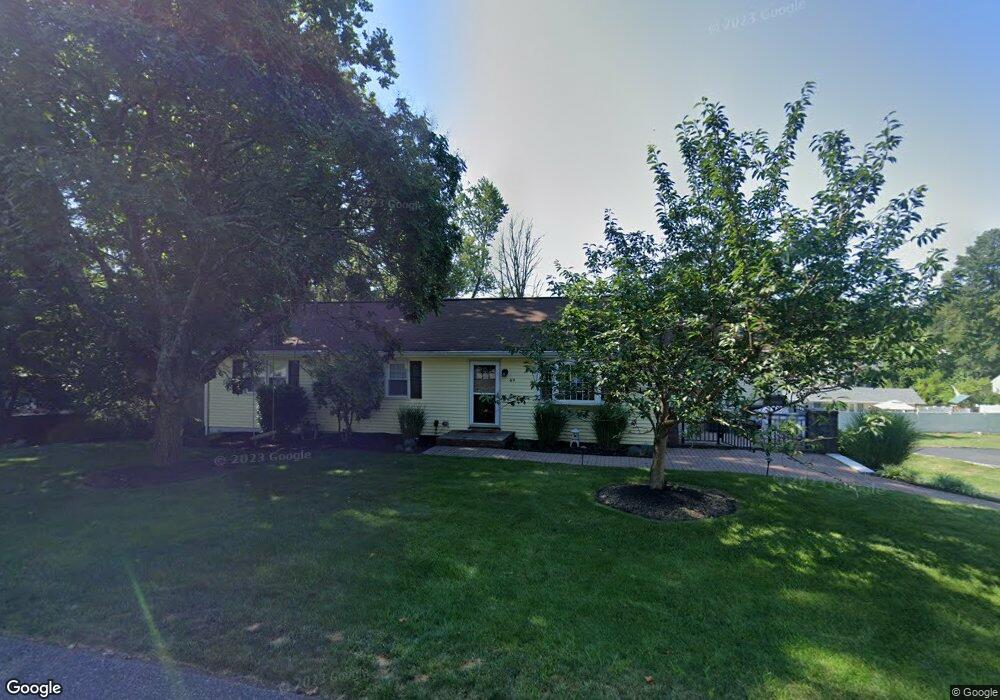
49 Beavers St High Bridge, NJ 08829
Estimated Value: $483,000 - $605,850
Studio
--
Bath
1,725
Sq Ft
$306/Sq Ft
Est. Value
About This Home
This home is located at 49 Beavers St, High Bridge, NJ 08829 and is currently estimated at $528,213, approximately $306 per square foot. 49 Beavers St is a home located in Hunterdon County with nearby schools including High Bridge Elementary School, High Bridge Middle School, and Voorhees High School.
Ownership History
Date
Name
Owned For
Owner Type
Purchase Details
Closed on
Oct 1, 2009
Sold by
Gursky Donald and Gursky Kathleen H
Bought by
Supnet Joseph J and Supnet Suzanne M
Current Estimated Value
Home Financials for this Owner
Home Financials are based on the most recent Mortgage that was taken out on this home.
Original Mortgage
$302,419
Outstanding Balance
$194,039
Interest Rate
5.14%
Mortgage Type
VA
Estimated Equity
$334,174
Create a Home Valuation Report for This Property
The Home Valuation Report is an in-depth analysis detailing your home's value as well as a comparison with similar homes in the area
Home Values in the Area
Average Home Value in this Area
Purchase History
| Date | Buyer | Sale Price | Title Company |
|---|---|---|---|
| Supnet Joseph J | $317,500 | None Available |
Source: Public Records
Mortgage History
| Date | Status | Borrower | Loan Amount |
|---|---|---|---|
| Open | Supnet Joseph J | $302,419 |
Source: Public Records
Tax History
| Year | Tax Paid | Tax Assessment Tax Assessment Total Assessment is a certain percentage of the fair market value that is determined by local assessors to be the total taxable value of land and additions on the property. | Land | Improvement |
|---|---|---|---|---|
| 2025 | $15,151 | $400,700 | $188,500 | $212,200 |
| 2024 | $13,882 | $464,200 | $152,700 | $311,500 |
| 2023 | $13,882 | $351,100 | $117,000 | $234,100 |
| 2022 | $11,686 | $280,400 | $101,600 | $178,800 |
| 2021 | $11,563 | $279,900 | $101,600 | $178,300 |
| 2020 | $11,476 | $279,900 | $101,600 | $178,300 |
| 2019 | $11,563 | $279,900 | $101,600 | $178,300 |
| 2018 | $10,989 | $277,300 | $99,000 | $178,300 |
| 2017 | $11,180 | $290,100 | $108,500 | $181,600 |
| 2016 | $11,050 | $290,100 | $108,500 | $181,600 |
| 2015 | $10,751 | $290,100 | $108,500 | $181,600 |
| 2014 | $10,126 | $295,300 | $140,200 | $155,100 |
Source: Public Records
Map
Nearby Homes
- 0 Beavers St
- 69 Beavers St
- 77 Main St
- 13 Fairview Ave
- 13 Chestnut Ct
- 3 Chestnut Ct
- 21 E Main St
- 56 E Main St
- 15 Patton St
- 10 Timbercroft Rd
- 36 Crestview Dr
- 5 Deer Run Dr
- 8 Appollo Place
- 521 Cokesbury Rd
- 3 Fulper Place
- 22 Fairview Ave
- 7 Rachel Ct
- 13 Mission Hills Rd Unit 3
- 22 Polktown Rd
- 9 Charles Ct
Your Personal Tour Guide
Ask me questions while you tour the home.