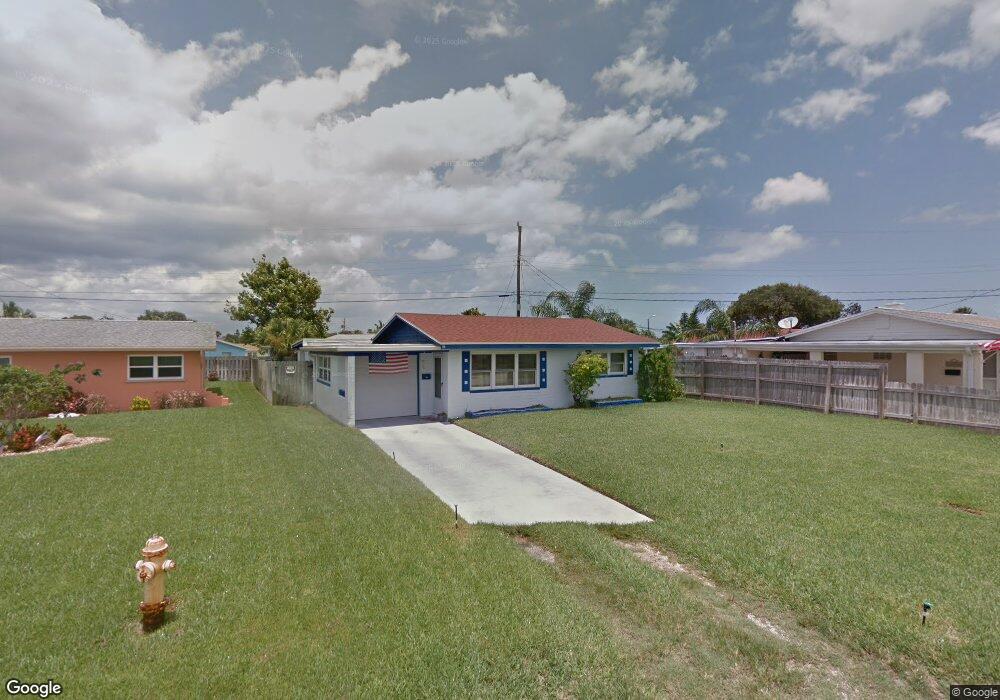
49 Beechwood Dr Ormond Beach, FL 32176
Estimated Value: $201,000 - $284,000
2
Beds
1
Bath
880
Sq Ft
$267/Sq Ft
Est. Value
About This Home
This home is located at 49 Beechwood Dr, Ormond Beach, FL 32176 and is currently estimated at $234,617, approximately $266 per square foot. 49 Beechwood Dr is a home located in Volusia County with nearby schools including Ormond Beach Middle School, Seabreeze High School, and St Brendan Catholic School.
Ownership History
Date
Name
Owned For
Owner Type
Purchase Details
Closed on
Dec 8, 2006
Sold by
Oreilly Mary K
Bought by
Oreilly Thomas
Current Estimated Value
Purchase Details
Closed on
Sep 3, 2003
Sold by
Oreilly Virginia and Oreilly Mary K
Bought by
Oreilly Thomas and Oreilly Mary K
Purchase Details
Closed on
Jul 18, 2000
Sold by
Oreilly Mary K
Bought by
Oreilly Mary K and Oreilly Virginia
Purchase Details
Closed on
Aug 16, 1999
Sold by
Hersome Susan S and Hersome John C
Bought by
Oreilly Mary
Home Financials for this Owner
Home Financials are based on the most recent Mortgage that was taken out on this home.
Original Mortgage
$32,000
Interest Rate
7.65%
Purchase Details
Closed on
Aug 22, 1993
Sold by
Hersome John C and Hersome Susan S
Bought by
Hersome Susan S
Purchase Details
Closed on
Jul 15, 1992
Bought by
Oreilly Thomas
Purchase Details
Closed on
Apr 15, 1983
Bought by
Oreilly Thomas
Create a Home Valuation Report for This Property
The Home Valuation Report is an in-depth analysis detailing your home's value as well as a comparison with similar homes in the area
Home Values in the Area
Average Home Value in this Area
Purchase History
| Date | Buyer | Sale Price | Title Company |
|---|---|---|---|
| Oreilly Thomas | -- | Attorney | |
| Oreilly Thomas | -- | -- | |
| Oreilly Mary K | -- | -- | |
| Oreilly Mary | $58,000 | -- | |
| Hersome Susan S | -- | -- | |
| Oreilly Thomas | $59,900 | -- | |
| Oreilly Thomas | $35,000 | -- |
Source: Public Records
Mortgage History
| Date | Status | Borrower | Loan Amount |
|---|---|---|---|
| Previous Owner | Oreilly Mary | $32,000 |
Source: Public Records
Tax History
| Year | Tax Paid | Tax Assessment Tax Assessment Total Assessment is a certain percentage of the fair market value that is determined by local assessors to be the total taxable value of land and additions on the property. | Land | Improvement |
|---|---|---|---|---|
| 2026 | $1,222 | $97,087 | -- | -- |
| 2025 | $1,222 | $94,535 | -- | -- |
| 2024 | $1,125 | $91,871 | -- | -- |
| 2023 | $1,125 | $89,196 | $0 | $0 |
| 2022 | $1,147 | $86,598 | $0 | $0 |
| 2021 | $1,150 | $84,076 | $0 | $0 |
| 2020 | $1,125 | $82,915 | $0 | $0 |
| 2019 | $1,102 | $81,051 | $0 | $0 |
| 2018 | $1,072 | $79,540 | $0 | $0 |
| 2017 | $1,035 | $77,904 | $0 | $0 |
| 2016 | $1,008 | $76,302 | $0 | $0 |
| 2015 | $1,024 | $75,772 | $0 | $0 |
| 2014 | $1,003 | $75,171 | $0 | $0 |
Source: Public Records
Map
Nearby Homes
- 55 Seaside Dr
- 1596 John Anderson Dr
- 30 Azalea Dr
- 31 River Shore Dr
- 4310 John Anderson Dr
- 29 Ocean Shore Dr
- 66 Ocean Shore Dr
- 59 Margaret Rd
- 42 Palmetto Dr
- 17 Poinsettia Dr
- 40 Palmetto Dr
- 28 Palm Dr
- 49 Alamanda Dr
- 26 Palm Dr
- 29 Palmetto Dr
- 82 Margaret Rd
- 22 Palm Dr
- 5 Seaside Dr
- 43 Hibiscus Dr
- 4 Ocean Shore Dr
Your Personal Tour Guide
Ask me questions while you tour the home.