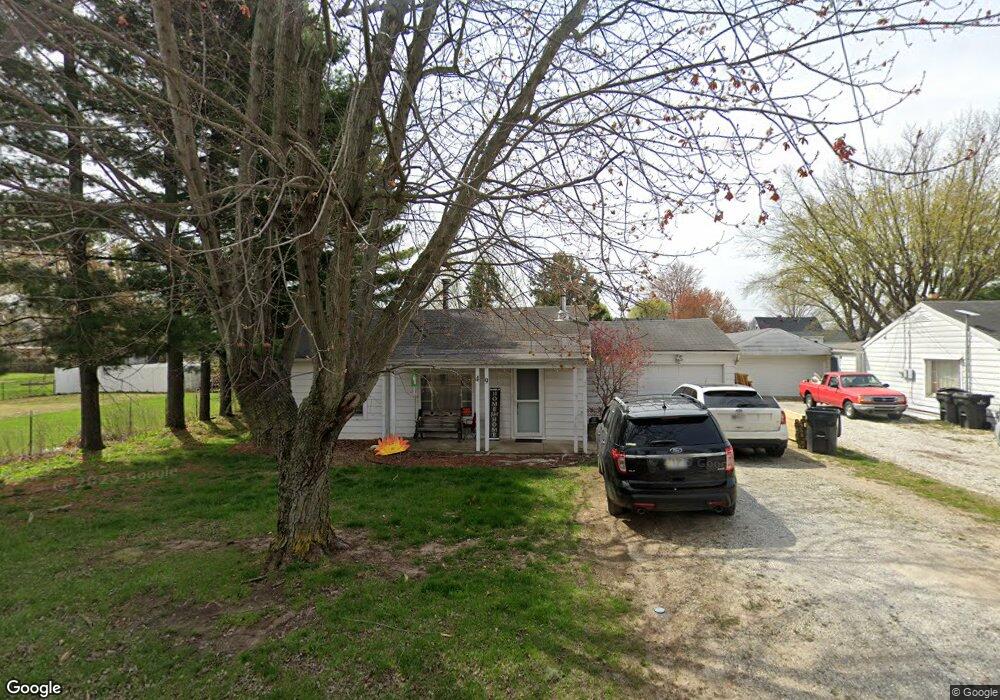
49 Broadway St Unit 1 Alexandria, IN 46001
Estimated Value: $49,000 - $206,000
3
Beds
1
Bath
984
Sq Ft
$127/Sq Ft
Est. Value
About This Home
This home is located at 49 Broadway St Unit 1, Alexandria, IN 46001 and is currently estimated at $124,639, approximately $126 per square foot. 49 Broadway St Unit 1 is a home located in Madison County with nearby schools including Alexandria-Monroe Intermediate School, Alexandria-Monroe Elementary, and Alexandria-Monroe High School.
Ownership History
Date
Name
Owned For
Owner Type
Purchase Details
Closed on
Nov 19, 2024
Sold by
Mcclain Noah
Bought by
Welborn Jeffrey
Current Estimated Value
Purchase Details
Closed on
Nov 18, 2024
Sold by
Welborn Jeffrey
Bought by
Huff Xavier
Create a Home Valuation Report for This Property
The Home Valuation Report is an in-depth analysis detailing your home's value as well as a comparison with similar homes in the area
Home Values in the Area
Average Home Value in this Area
Purchase History
| Date | Buyer | Sale Price | Title Company |
|---|---|---|---|
| Welborn Jeffrey | -- | None Listed On Document | |
| Welborn Jeffrey | -- | None Listed On Document | |
| Huff Xavier | -- | None Listed On Document | |
| Huff Xavier | -- | None Listed On Document |
Source: Public Records
Mortgage History
| Date | Status | Borrower | Loan Amount |
|---|---|---|---|
| Previous Owner | Welborn Jeffrey A | $30,000 |
Source: Public Records
Tax History Compared to Growth
Tax History
| Year | Tax Paid | Tax Assessment Tax Assessment Total Assessment is a certain percentage of the fair market value that is determined by local assessors to be the total taxable value of land and additions on the property. | Land | Improvement |
|---|---|---|---|---|
| 2024 | $327 | $65,200 | $10,700 | $54,500 |
| 2023 | $320 | $60,600 | $10,200 | $50,400 |
| 2022 | $1,227 | $60,100 | $9,700 | $50,400 |
| 2021 | $1,325 | $58,500 | $9,700 | $48,800 |
| 2020 | $1,192 | $55,800 | $9,300 | $46,500 |
| 2019 | $1,207 | $55,800 | $9,300 | $46,500 |
| 2018 | $1,082 | $52,700 | $9,300 | $43,400 |
| 2017 | $923 | $53,700 | $9,300 | $44,400 |
| 2016 | $194 | $53,700 | $9,300 | $44,400 |
| 2014 | $179 | $52,900 | $9,300 | $43,600 |
| 2013 | $179 | $52,900 | $9,300 | $43,600 |
Source: Public Records
Map
Nearby Homes
- 51 E Oak St
- 11749 N 300 W
- 1974 W State Road 28
- 10699 N 200 W
- 1130 W State Road 28
- 1102 W Monroe St
- 1310 W 1st St
- 1737 W 1000 N
- 1001 W 3rd St
- 0 Sutton St Unit MBR22016702
- 615 W Jefferson St
- 504 W Monroe St
- 402 W Madison St
- 305 W Monroe St
- 209 W Broadway St
- 0 Jackson Unit MBR22055133
- 123 S Canal St
- 1405 N Harrison St
- 107 E Garfield St
- 113 E Polk St