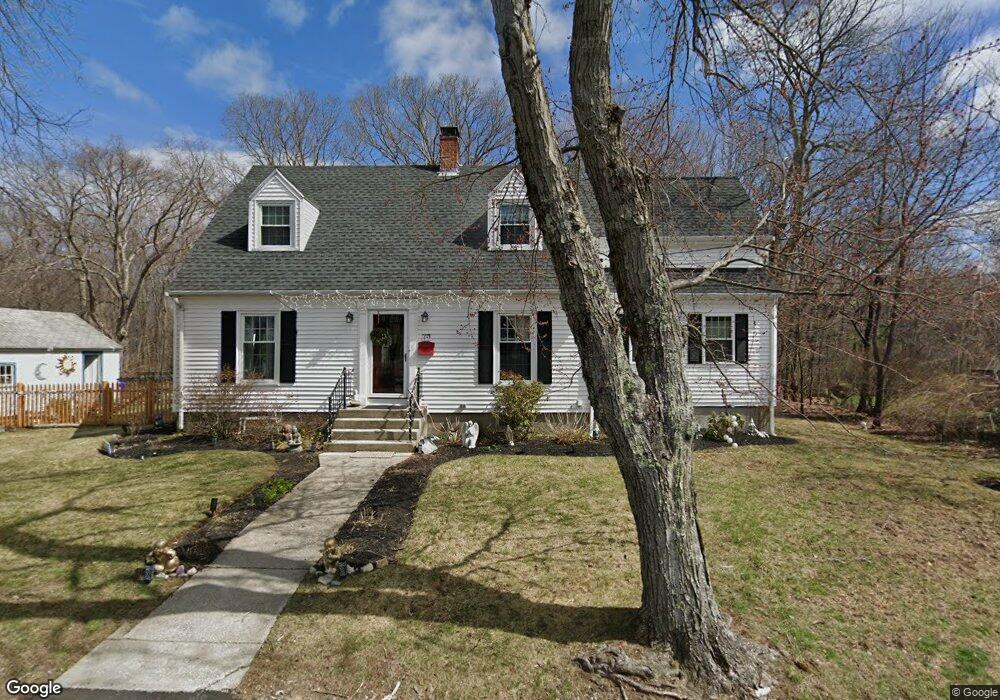
49 Brooks St Maynard, MA 01754
Estimated Value: $642,000 - $718,000
3
Beds
2
Baths
1,908
Sq Ft
$358/Sq Ft
Est. Value
About This Home
This home is located at 49 Brooks St, Maynard, MA 01754 and is currently estimated at $682,323, approximately $357 per square foot. 49 Brooks St is a home located in Middlesex County with nearby schools including Green Meadow School, Fowler School, and Maynard High School.
Ownership History
Date
Name
Owned For
Owner Type
Purchase Details
Closed on
Feb 24, 2003
Sold by
Gregorie Extrx Sandra and Rutanen Stephanie A
Bought by
Glass Jonathan M and Kaufman-Glass Katherine E
Current Estimated Value
Home Financials for this Owner
Home Financials are based on the most recent Mortgage that was taken out on this home.
Original Mortgage
$271,700
Outstanding Balance
$117,656
Interest Rate
5.98%
Mortgage Type
Purchase Money Mortgage
Estimated Equity
$564,667
Create a Home Valuation Report for This Property
The Home Valuation Report is an in-depth analysis detailing your home's value as well as a comparison with similar homes in the area
Home Values in the Area
Average Home Value in this Area
Purchase History
| Date | Buyer | Sale Price | Title Company |
|---|---|---|---|
| Glass Jonathan M | $286,500 | -- |
Source: Public Records
Mortgage History
| Date | Status | Borrower | Loan Amount |
|---|---|---|---|
| Open | Glass Jonathan M | $271,700 |
Source: Public Records
Tax History
| Year | Tax Paid | Tax Assessment Tax Assessment Total Assessment is a certain percentage of the fair market value that is determined by local assessors to be the total taxable value of land and additions on the property. | Land | Improvement |
|---|---|---|---|---|
| 2025 | $9,906 | $555,600 | $279,000 | $276,600 |
| 2024 | $9,282 | $519,100 | $265,800 | $253,300 |
| 2023 | $9,159 | $482,800 | $253,100 | $229,700 |
| 2022 | $9,074 | $442,200 | $212,600 | $229,600 |
| 2021 | $8,656 | $429,600 | $212,600 | $217,000 |
| 2020 | $8,450 | $409,400 | $192,400 | $217,000 |
| 2019 | $8,355 | $397,100 | $183,800 | $213,300 |
| 2018 | $7,958 | $351,500 | $167,000 | $184,500 |
| 2017 | $7,737 | $351,500 | $167,000 | $184,500 |
| 2016 | $7,469 | $351,500 | $167,000 | $184,500 |
| 2015 | $7,043 | $315,700 | $159,500 | $156,200 |
| 2014 | $6,841 | $306,900 | $154,400 | $152,500 |
Source: Public Records
Map
Nearby Homes
- 12 Brown St
- 36 Brown St
- 153 Summer St
- 63 Conant St
- 10 Mill St Unit B
- 66 Powder Mill Rd
- 68 Powder Mill Rd
- 70 Powder Mill Rd
- 22 Douglas Ave Unit 2
- 22 Douglas Ave Unit 1
- 13 Arthur St Unit 15
- 5 Hayes St Unit 5
- 31-33 Roosevelt St
- 41 Taylor Rd
- 23 Deer Path Unit 5
- 40 High St
- 30 Brewster Ln
- 1 Drummer Rd Unit A5
- 128 Parker St Unit 3B
- 131 Main St
Your Personal Tour Guide
Ask me questions while you tour the home.