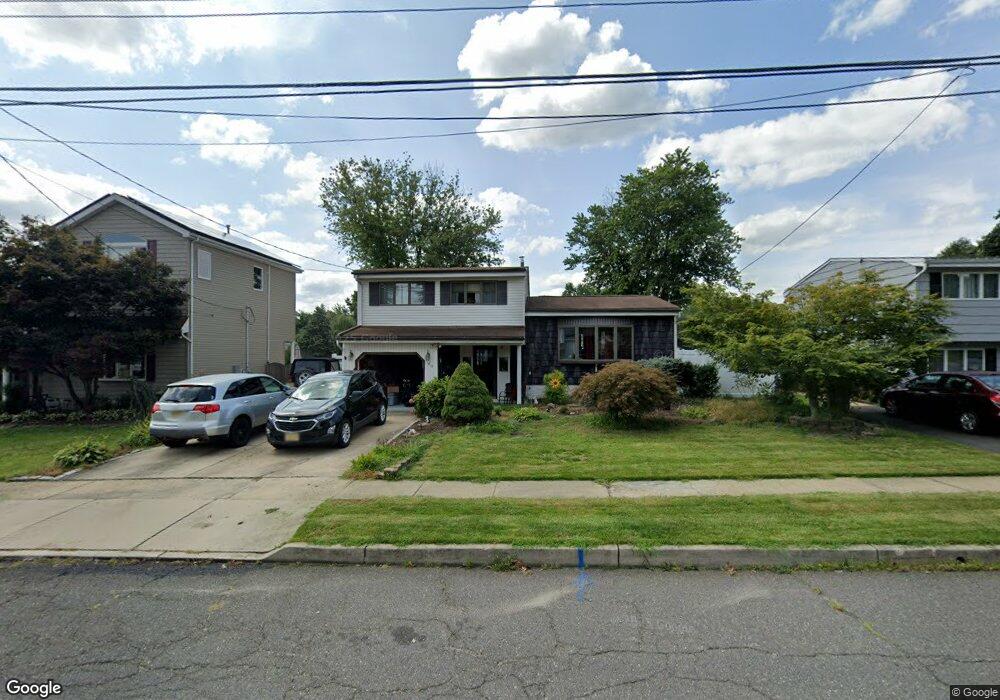
49 Cindy St Old Bridge, NJ 08857
Estimated Value: $550,920 - $685,000
--
Bed
--
Bath
1,844
Sq Ft
$347/Sq Ft
Est. Value
About This Home
This home is located at 49 Cindy St, Old Bridge, NJ 08857 and is currently estimated at $640,730, approximately $347 per square foot. 49 Cindy St is a home located in Middlesex County with nearby schools including Old Bridge High School, St. Ambrose School, and Calvary Christian School.
Ownership History
Date
Name
Owned For
Owner Type
Purchase Details
Closed on
May 18, 2018
Sold by
Mulvey Colleen and Cistone Colleen
Bought by
Mulvey William and Mulvey Colleen M
Current Estimated Value
Home Financials for this Owner
Home Financials are based on the most recent Mortgage that was taken out on this home.
Original Mortgage
$100,000
Outstanding Balance
$59,249
Interest Rate
4.4%
Mortgage Type
New Conventional
Estimated Equity
$581,481
Purchase Details
Closed on
May 25, 2016
Sold by
Cistone Anthony and Cistone Collen
Bought by
Cistone Colleen
Purchase Details
Closed on
May 22, 1997
Sold by
Mcneilis John
Bought by
Cistone Anthony and Cistone Colleen
Home Financials for this Owner
Home Financials are based on the most recent Mortgage that was taken out on this home.
Original Mortgage
$95,000
Interest Rate
8.08%
Create a Home Valuation Report for This Property
The Home Valuation Report is an in-depth analysis detailing your home's value as well as a comparison with similar homes in the area
Home Values in the Area
Average Home Value in this Area
Purchase History
| Date | Buyer | Sale Price | Title Company |
|---|---|---|---|
| Mulvey William | $100,000 | None Available | |
| Cistone Colleen | -- | None Available | |
| Cistone Anthony | $175,000 | -- |
Source: Public Records
Mortgage History
| Date | Status | Borrower | Loan Amount |
|---|---|---|---|
| Open | Mulvey William | $100,000 | |
| Previous Owner | Cistone Anthony | $95,000 |
Source: Public Records
Tax History Compared to Growth
Tax History
| Year | Tax Paid | Tax Assessment Tax Assessment Total Assessment is a certain percentage of the fair market value that is determined by local assessors to be the total taxable value of land and additions on the property. | Land | Improvement |
|---|---|---|---|---|
| 2025 | $9,142 | $161,900 | $69,000 | $92,900 |
| 2024 | $8,770 | $161,900 | $69,000 | $92,900 |
| 2023 | $8,770 | $161,900 | $69,000 | $92,900 |
| 2022 | $8,569 | $161,900 | $69,000 | $92,900 |
| 2021 | $6,289 | $161,900 | $69,000 | $92,900 |
| 2020 | $8,317 | $161,900 | $69,000 | $92,900 |
| 2019 | $8,176 | $161,900 | $69,000 | $92,900 |
| 2018 | $8,085 | $161,900 | $69,000 | $92,900 |
| 2017 | $7,823 | $161,900 | $69,000 | $92,900 |
| 2016 | $7,661 | $161,900 | $69,000 | $92,900 |
| 2015 | $7,528 | $161,900 | $69,000 | $92,900 |
| 2014 | $7,452 | $161,900 | $69,000 | $92,900 |
Source: Public Records
Map
Nearby Homes