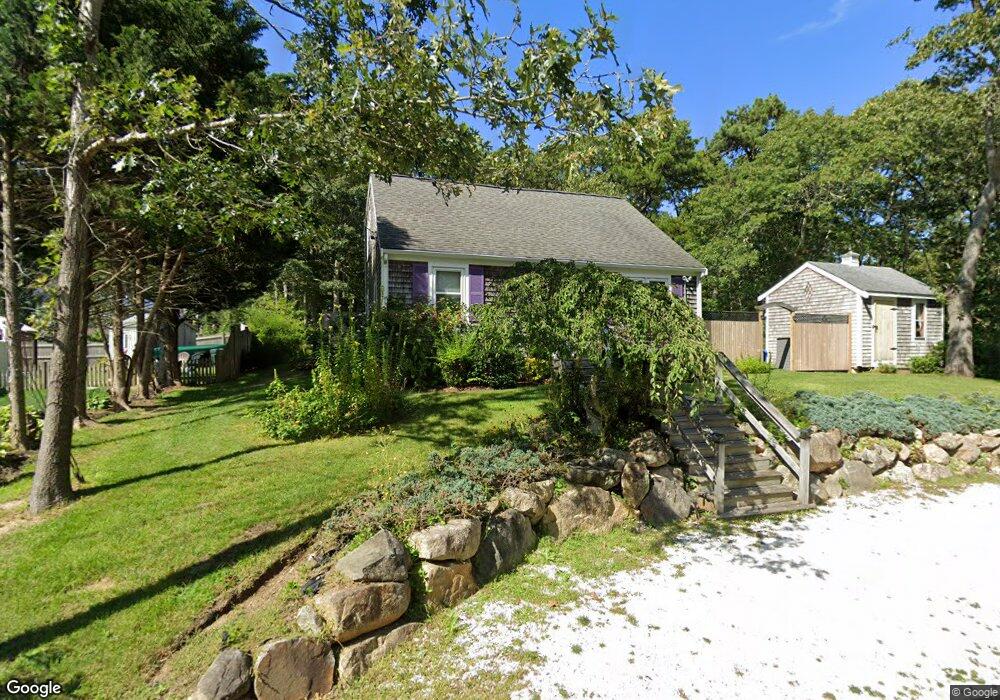
49 Cliff St Dennis, MA 02638
Dennis Village NeighborhoodEstimated Value: $631,000 - $802,000
3
Beds
2
Baths
1,201
Sq Ft
$596/Sq Ft
Est. Value
About This Home
This home is located at 49 Cliff St, Dennis, MA 02638 and is currently estimated at $715,574, approximately $595 per square foot. 49 Cliff St is a home located in Barnstable County with nearby schools including Dennis-Yarmouth Regional High School and St. Pius X. School.
Ownership History
Date
Name
Owned For
Owner Type
Purchase Details
Closed on
Nov 2, 2004
Sold by
Brogan Louise
Bought by
Brogan Rt
Current Estimated Value
Purchase Details
Closed on
May 10, 2000
Sold by
Monac Edward J and Monac Clare R
Bought by
Brogan Louise E
Home Financials for this Owner
Home Financials are based on the most recent Mortgage that was taken out on this home.
Original Mortgage
$117,000
Interest Rate
8.21%
Mortgage Type
Purchase Money Mortgage
Purchase Details
Closed on
May 19, 1998
Sold by
Mcneill Barbara J and Mcneill Daniel W
Bought by
Monac Edward J and Monac Clare R
Create a Home Valuation Report for This Property
The Home Valuation Report is an in-depth analysis detailing your home's value as well as a comparison with similar homes in the area
Home Values in the Area
Average Home Value in this Area
Purchase History
| Date | Buyer | Sale Price | Title Company |
|---|---|---|---|
| Brogan Rt | -- | -- | |
| Brogan Louise E | $152,000 | -- | |
| Monac Edward J | $16,500 | -- |
Source: Public Records
Mortgage History
| Date | Status | Borrower | Loan Amount |
|---|---|---|---|
| Previous Owner | Brogan Louise E | $117,000 |
Source: Public Records
Tax History Compared to Growth
Tax History
| Year | Tax Paid | Tax Assessment Tax Assessment Total Assessment is a certain percentage of the fair market value that is determined by local assessors to be the total taxable value of land and additions on the property. | Land | Improvement |
|---|---|---|---|---|
| 2025 | $2,514 | $580,600 | $181,300 | $399,300 |
| 2024 | $2,467 | $562,000 | $174,400 | $387,600 |
| 2023 | $2,272 | $486,500 | $134,100 | $352,400 |
| 2022 | $2,167 | $386,900 | $120,800 | $266,100 |
| 2021 | $1,989 | $329,800 | $118,500 | $211,300 |
| 2020 | $2,261 | $370,700 | $129,200 | $241,500 |
| 2019 | $2,322 | $376,400 | $158,400 | $218,000 |
| 2018 | $2,102 | $331,500 | $120,600 | $210,900 |
| 2017 | $2,039 | $331,500 | $120,600 | $210,900 |
| 2016 | $1,964 | $300,700 | $120,600 | $180,100 |
| 2015 | $1,924 | $300,700 | $120,600 | $180,100 |
| 2014 | $1,746 | $275,000 | $100,500 | $174,500 |
Source: Public Records
Map
Nearby Homes
- 59 Main St Unit 19-2
- 59 Route 6a Unit 29-4
- 13 Covey Dr
- 268 Main St
- 6 Nimble Hill Dr
- 51 Bray Farm Rd N
- 4 Ebb Rd
- 11 Uncle Stanleys Way
- 111 Merchant Ave
- 153 Bayridge Dr
- 15 Captain Jud Rd
- 6 Thomas Ct
- 15 Signal Hill Dr
- 44 Stratford Ln
- 64 Kates Path
- 35 Crown Grant Dr
- 42 John Hall Cartway Unit 42
- 50 John Hall Cartway
- 50 John Hall Cartway Unit 50