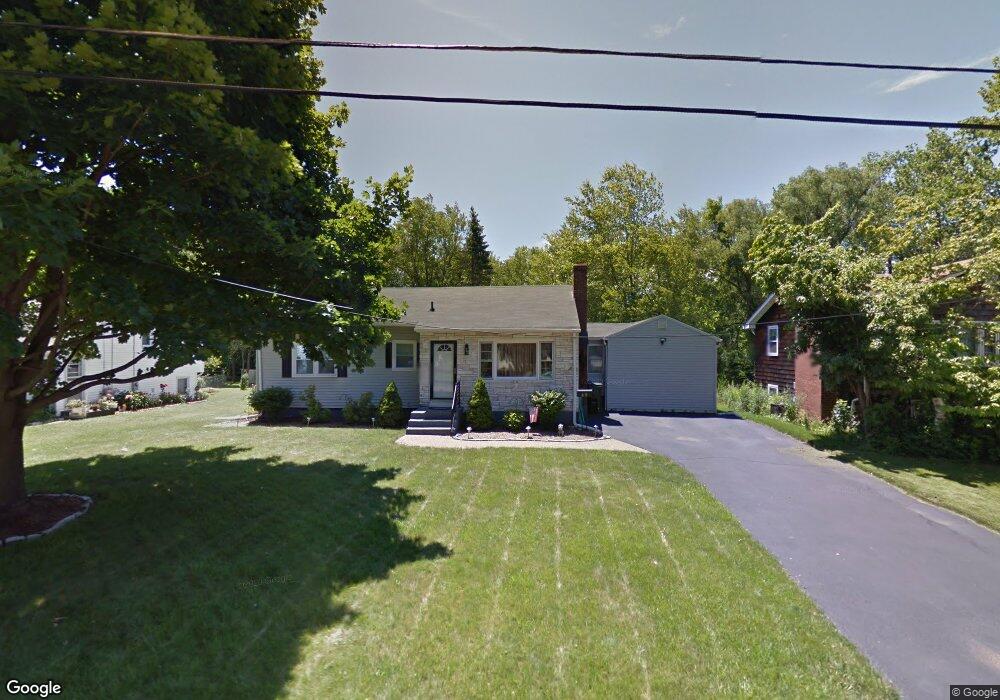
49 Coles Ave Newington, CT 06111
Estimated Value: $381,000 - $405,000
2
Beds
1
Bath
1,346
Sq Ft
$290/Sq Ft
Est. Value
About This Home
This home is located at 49 Coles Ave, Newington, CT 06111 and is currently estimated at $390,879, approximately $290 per square foot. 49 Coles Ave is a home located in Hartford County with nearby schools including Ruth Chaffee School, John Wallace Middle School, and Newington High School.
Ownership History
Date
Name
Owned For
Owner Type
Purchase Details
Closed on
Mar 27, 2008
Sold by
Dube Dean A and Dube Margaret
Bought by
Lazo-Vasquez Marvin A
Current Estimated Value
Home Financials for this Owner
Home Financials are based on the most recent Mortgage that was taken out on this home.
Original Mortgage
$214,000
Outstanding Balance
$133,462
Interest Rate
5.76%
Mortgage Type
VA
Estimated Equity
$257,417
Purchase Details
Closed on
Dec 2, 2004
Sold by
Canino James C and Canino Michele
Bought by
Dube Dean A and Dube Margaret
Home Financials for this Owner
Home Financials are based on the most recent Mortgage that was taken out on this home.
Original Mortgage
$167,920
Interest Rate
6.55%
Purchase Details
Closed on
Dec 14, 1998
Sold by
New Haven Sb
Bought by
Canino James C
Purchase Details
Closed on
Jul 12, 1991
Sold by
Pietrowicz Gary M and Pietrowicz Mark R
Bought by
Defreitas Mauricio and Defreitas Theresa
Create a Home Valuation Report for This Property
The Home Valuation Report is an in-depth analysis detailing your home's value as well as a comparison with similar homes in the area
Home Values in the Area
Average Home Value in this Area
Purchase History
| Date | Buyer | Sale Price | Title Company |
|---|---|---|---|
| Lazo-Vasquez Marvin A | $214,000 | -- | |
| Dube Dean A | $209,900 | -- | |
| Canino James C | $111,000 | -- | |
| Defreitas Mauricio | $139,000 | -- |
Source: Public Records
Mortgage History
| Date | Status | Borrower | Loan Amount |
|---|---|---|---|
| Open | Defreitas Mauricio | $214,000 | |
| Previous Owner | Defreitas Mauricio | $167,920 | |
| Previous Owner | Defreitas Mauricio | $41,980 |
Source: Public Records
Tax History Compared to Growth
Tax History
| Year | Tax Paid | Tax Assessment Tax Assessment Total Assessment is a certain percentage of the fair market value that is determined by local assessors to be the total taxable value of land and additions on the property. | Land | Improvement |
|---|---|---|---|---|
| 2025 | $6,167 | $154,240 | $52,500 | $101,740 |
| 2024 | $6,119 | $154,240 | $52,500 | $101,740 |
| 2023 | $5,917 | $154,240 | $52,500 | $101,740 |
| 2022 | $5,937 | $154,240 | $52,500 | $101,740 |
| 2021 | $5,986 | $154,240 | $52,500 | $101,740 |
| 2020 | $5,768 | $146,850 | $52,500 | $94,350 |
| 2019 | $5,793 | $146,850 | $52,500 | $94,350 |
| 2018 | $5,654 | $146,850 | $52,500 | $94,350 |
| 2017 | $5,643 | $154,230 | $52,500 | $101,730 |
| 2016 | $5,514 | $154,230 | $52,500 | $101,730 |
| 2014 | $5,483 | $157,690 | $52,530 | $105,160 |
Source: Public Records
Map
Nearby Homes
- 76 Clifford St
- 129 Glenview Dr
- 263 Robbins Ave
- 5 Copper Beech Ln
- 340 Robbins Ave
- 36 Sequin St
- 31 Fox Run Ct Unit 31
- 137 Superior Ave
- 193 Hillcrest Ave
- 107 Fox Run Ct Unit 107
- 120 Fox Run Ct
- 149 Foxboro Dr Unit 149
- 111 Brockett St
- 43 Steeplechase Dr Unit 43
- 91 Centerwood Rd
- 98 Crown Ridge
- 11 Eleanor Place
- 760 Willard Ave
- 36 Hartt Ln
- 31 Henry Ave