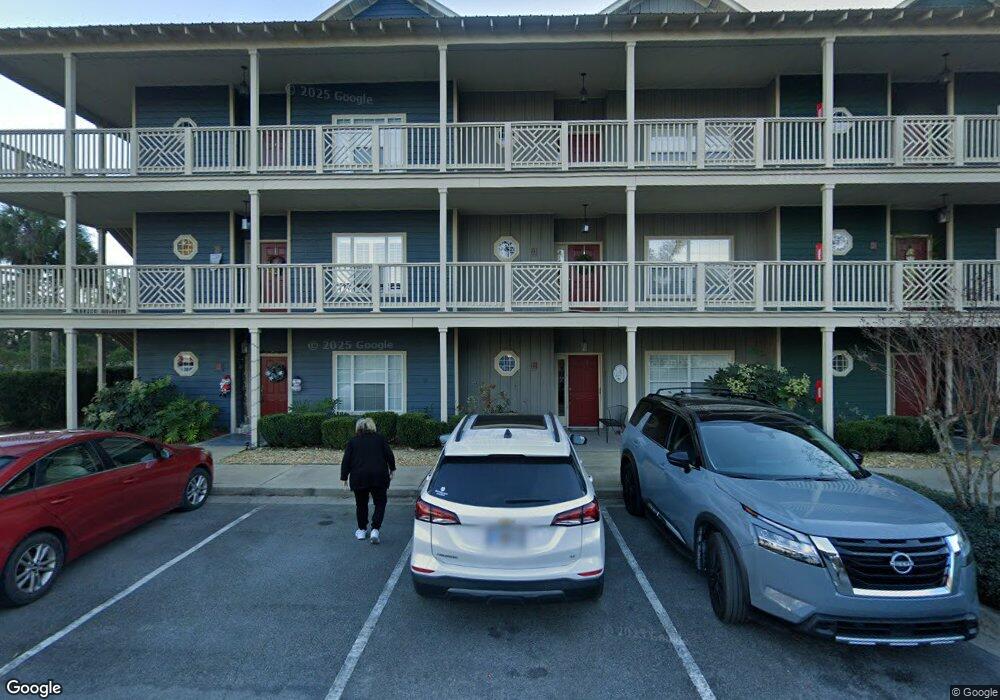
49 Cuddy Ln Unit 23 Midway, GA 31320
Estimated Value: $302,000 - $355,000
2
Beds
2
Baths
1,278
Sq Ft
$252/Sq Ft
Est. Value
About This Home
This home is located at 49 Cuddy Ln Unit 23, Midway, GA 31320 and is currently estimated at $321,711, approximately $251 per square foot. 49 Cuddy Ln Unit 23 is a home located in Liberty County with nearby schools including Liberty Elementary School, Midway Middle School, and Liberty County High School.
Ownership History
Date
Name
Owned For
Owner Type
Purchase Details
Closed on
Mar 11, 2022
Sold by
White Jack J
Bought by
White Robert T and White Kelly D
Current Estimated Value
Home Financials for this Owner
Home Financials are based on the most recent Mortgage that was taken out on this home.
Original Mortgage
$204,375
Outstanding Balance
$190,952
Interest Rate
3.92%
Mortgage Type
New Conventional
Estimated Equity
$130,759
Purchase Details
Closed on
Oct 13, 2017
Sold by
Hawkins Kristina C
Bought by
White Jack J and White Cynthia L
Home Financials for this Owner
Home Financials are based on the most recent Mortgage that was taken out on this home.
Original Mortgage
$195,750
Interest Rate
3.78%
Mortgage Type
New Conventional
Purchase Details
Closed on
Apr 30, 2003
Sold by
Terra Firma Development Llc
Bought by
Hawkins Kristina C
Create a Home Valuation Report for This Property
The Home Valuation Report is an in-depth analysis detailing your home's value as well as a comparison with similar homes in the area
Home Values in the Area
Average Home Value in this Area
Purchase History
| Date | Buyer | Sale Price | Title Company |
|---|---|---|---|
| White Robert T | $272,500 | -- | |
| White Jack J | $217,500 | -- | |
| Hawkins Kristina C | $194,000 | -- |
Source: Public Records
Mortgage History
| Date | Status | Borrower | Loan Amount |
|---|---|---|---|
| Open | White Robert T | $204,375 | |
| Previous Owner | White Jack J | $195,750 |
Source: Public Records
Tax History Compared to Growth
Tax History
| Year | Tax Paid | Tax Assessment Tax Assessment Total Assessment is a certain percentage of the fair market value that is determined by local assessors to be the total taxable value of land and additions on the property. | Land | Improvement |
|---|---|---|---|---|
| 2024 | $3,865 | $108,801 | $7,200 | $101,601 |
| 2023 | $3,865 | $95,956 | $7,200 | $88,756 |
| 2022 | $2,469 | $79,946 | $7,200 | $72,746 |
| 2021 | $2,382 | $79,754 | $7,200 | $72,554 |
| 2020 | $2,767 | $77,112 | $7,200 | $69,912 |
| 2019 | $2,614 | $74,710 | $7,200 | $67,510 |
| 2018 | $2,491 | $72,234 | $7,200 | $65,034 |
| 2017 | $1,288 | $39,104 | $7,200 | $31,904 |
| 2016 | $1,360 | $39,462 | $7,200 | $32,262 |
| 2015 | $1,432 | $39,462 | $7,200 | $32,262 |
| 2014 | $1,432 | $41,092 | $7,200 | $33,892 |
| 2013 | -- | $81,388 | $7,200 | $74,188 |
Source: Public Records
Map
Nearby Homes
- 66 Galley Ln Unit 12
- 91 Sir Edward Teach Rd
- 73 Tondee Way
- 45 Dutchman's Cove Rd
- 4787 Sunbury Rd
- 94 Rookery View Dr
- 1734 Fort Morris Rd
- 22651 Ga Highway 144
- 430 Fancy Ct
- 22651 Georgia 144
- 0 Steeple Chase Ln
- 22532 Georgia 144
- 187 Demeries Lake Ln
- Lot 21 Amarula Ln
- 24 Demeries Lake Ct
- 331 Silver Stream Ln
- 0 Hager Ln Unit SA339320
- 291 Kerry Dr
- 252 River Dr
- 1587 Belle Island Rd
- 49 Cuddy Ln Unit 22
- 49 Cuddy Ln Unit 32
- 49 Cuddy Ln Unit 11
- 49 Cuddy Ln
- 49 Cuddy Ln
- 49 Cuddy Ln
- 49 Cuddy Ln
- 49 Cuddy Ln
- 49 Cuddy Ln
- 49 Cuddy Ln
- 49 Cuddy Ln
- 49 Cuddy Ln
- 49 Cuddy Ln Unit 33
- 49 Cuddy Ln Unit 31
- 49 Cuddy Ln Unit 32
- 66 Galley Ln Unit 33
- 66 Galley Ln Unit 32
- 66 Galley Ln Unit 22
- 66 Galley Ln Unit 23
- 66 Galley Ln