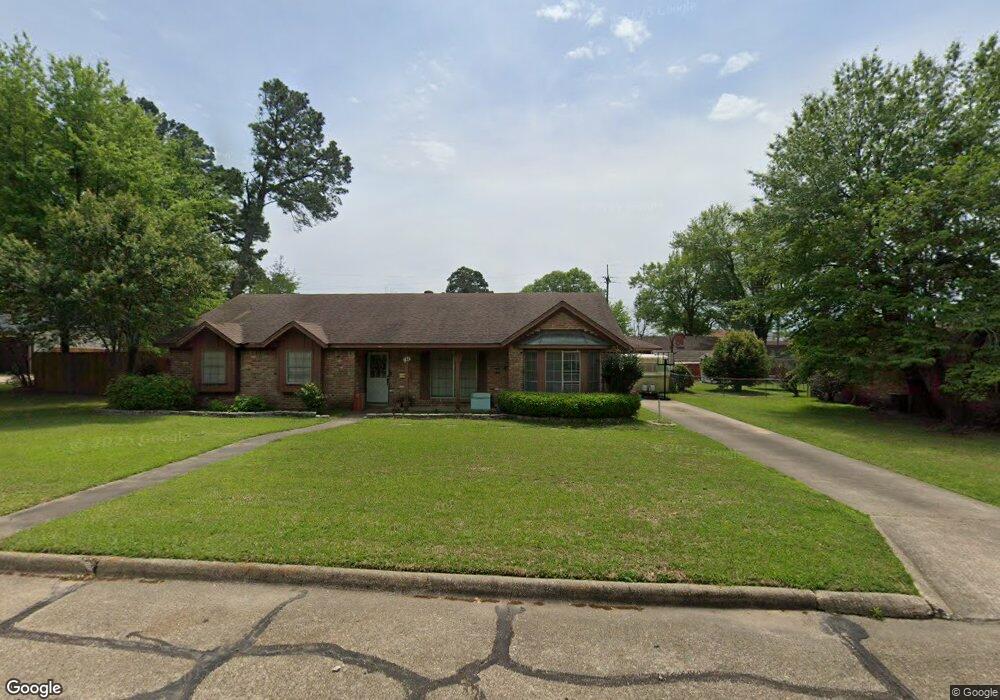
49 Desoto Cir Texarkana, TX 75503
Estimated Value: $200,029 - $241,000
3
Beds
2
Baths
1,916
Sq Ft
$113/Sq Ft
Est. Value
About This Home
This home is located at 49 Desoto Cir, Texarkana, TX 75503 and is currently estimated at $216,507, approximately $112 per square foot. 49 Desoto Cir is a home located in Bowie County with nearby schools including Spring Lake Park Elementary School, Texas Middle School, and Texas High School.
Ownership History
Date
Name
Owned For
Owner Type
Purchase Details
Closed on
Feb 11, 2021
Sold by
Saulsbury Kolton
Bought by
Saulsbury Cydney
Current Estimated Value
Purchase Details
Closed on
Sep 29, 2015
Sold by
Fisher Jack D and Howdeshell Laura Fisher
Bought by
Minter Cyndey M
Home Financials for this Owner
Home Financials are based on the most recent Mortgage that was taken out on this home.
Original Mortgage
$112,100
Outstanding Balance
$88,227
Interest Rate
3.97%
Mortgage Type
New Conventional
Estimated Equity
$128,280
Create a Home Valuation Report for This Property
The Home Valuation Report is an in-depth analysis detailing your home's value as well as a comparison with similar homes in the area
Home Values in the Area
Average Home Value in this Area
Purchase History
| Date | Buyer | Sale Price | Title Company |
|---|---|---|---|
| Saulsbury Cydney | -- | None Available | |
| Minter Cyndey M | $112,100 | None Available |
Source: Public Records
Mortgage History
| Date | Status | Borrower | Loan Amount |
|---|---|---|---|
| Open | Minter Cyndey M | $112,100 |
Source: Public Records
Tax History Compared to Growth
Tax History
| Year | Tax Paid | Tax Assessment Tax Assessment Total Assessment is a certain percentage of the fair market value that is determined by local assessors to be the total taxable value of land and additions on the property. | Land | Improvement |
|---|---|---|---|---|
| 2025 | $3,930 | $170,085 | $20,000 | $150,085 |
| 2024 | $3,930 | $166,009 | $20,000 | $146,009 |
| 2023 | $3,749 | $158,309 | $20,000 | $138,309 |
| 2022 | $3,357 | $140,635 | $20,000 | $120,635 |
| 2021 | $2,960 | $115,761 | $15,000 | $100,761 |
| 2020 | $2,862 | $111,316 | $15,000 | $96,316 |
| 2019 | $2,857 | $107,094 | $15,000 | $92,094 |
| 2018 | $2,817 | $105,594 | $15,000 | $90,594 |
| 2017 | $2,766 | $103,990 | $15,000 | $88,990 |
| 2016 | $2,766 | $103,990 | $15,000 | $88,990 |
| 2015 | $2,591 | $103,197 | $15,000 | $88,197 |
| 2014 | $2,591 | $100,138 | $15,000 | $85,138 |
Source: Public Records
Map
Nearby Homes