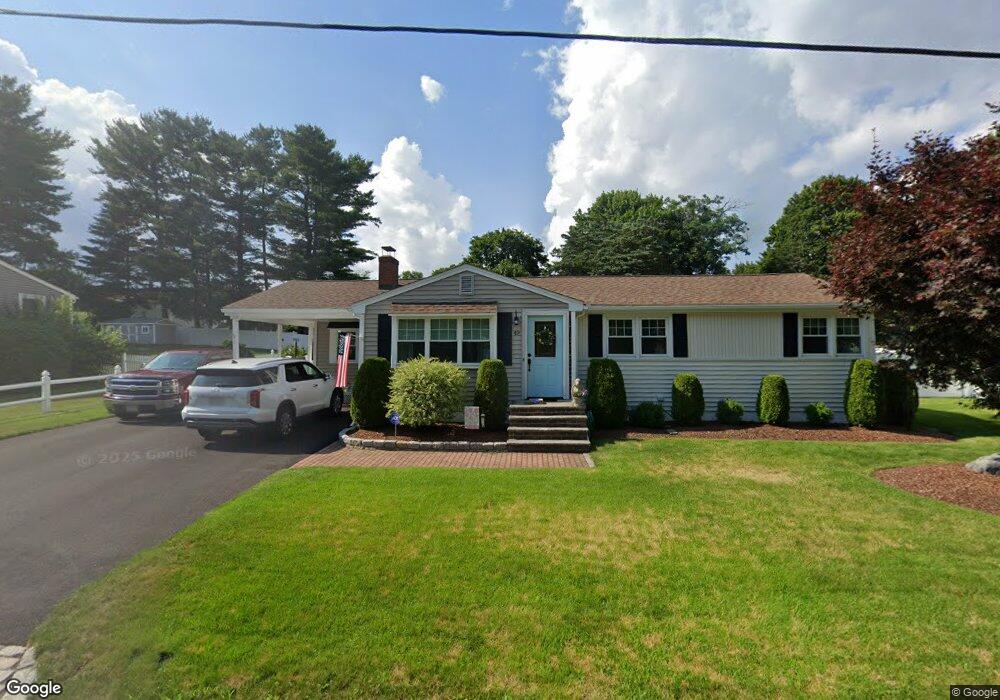
49 Duncan Rd Stoughton, MA 02072
Estimated Value: $551,000 - $658,658
3
Beds
2
Baths
1,874
Sq Ft
$330/Sq Ft
Est. Value
About This Home
This home is located at 49 Duncan Rd, Stoughton, MA 02072 and is currently estimated at $618,415, approximately $329 per square foot. 49 Duncan Rd is a home located in Norfolk County with nearby schools including South Elementary School, Dr. Robert G. O'Donnell Middle School, and Stoughton High School.
Ownership History
Date
Name
Owned For
Owner Type
Purchase Details
Closed on
Jun 5, 1990
Sold by
Welch William W
Bought by
Bucaria Eric P
Current Estimated Value
Create a Home Valuation Report for This Property
The Home Valuation Report is an in-depth analysis detailing your home's value as well as a comparison with similar homes in the area
Home Values in the Area
Average Home Value in this Area
Purchase History
| Date | Buyer | Sale Price | Title Company |
|---|---|---|---|
| Bucaria Eric P | $132,000 | -- | |
| Bucaria Eric P | $132,000 | -- |
Source: Public Records
Mortgage History
| Date | Status | Borrower | Loan Amount |
|---|---|---|---|
| Open | Bucaria Eric P | $85,000 | |
| Closed | Bucaria Eric P | $80,000 | |
| Closed | Bucaria Eric P | $80,000 |
Source: Public Records
Tax History Compared to Growth
Tax History
| Year | Tax Paid | Tax Assessment Tax Assessment Total Assessment is a certain percentage of the fair market value that is determined by local assessors to be the total taxable value of land and additions on the property. | Land | Improvement |
|---|---|---|---|---|
| 2025 | $6,595 | $532,700 | $222,200 | $310,500 |
| 2024 | $6,494 | $510,100 | $203,000 | $307,100 |
| 2023 | $6,264 | $462,300 | $185,500 | $276,800 |
| 2022 | $6,117 | $424,500 | $178,500 | $246,000 |
| 2021 | $5,669 | $375,400 | $157,500 | $217,900 |
| 2020 | $5,590 | $375,400 | $157,500 | $217,900 |
| 2019 | $5,483 | $357,400 | $157,500 | $199,900 |
| 2018 | $4,936 | $333,300 | $150,500 | $182,800 |
| 2017 | $4,735 | $326,800 | $148,700 | $178,100 |
| 2016 | $4,439 | $296,500 | $134,700 | $161,800 |
| 2015 | $4,380 | $289,500 | $127,700 | $161,800 |
| 2014 | $4,103 | $260,700 | $117,200 | $143,500 |
Source: Public Records
Map
Nearby Homes