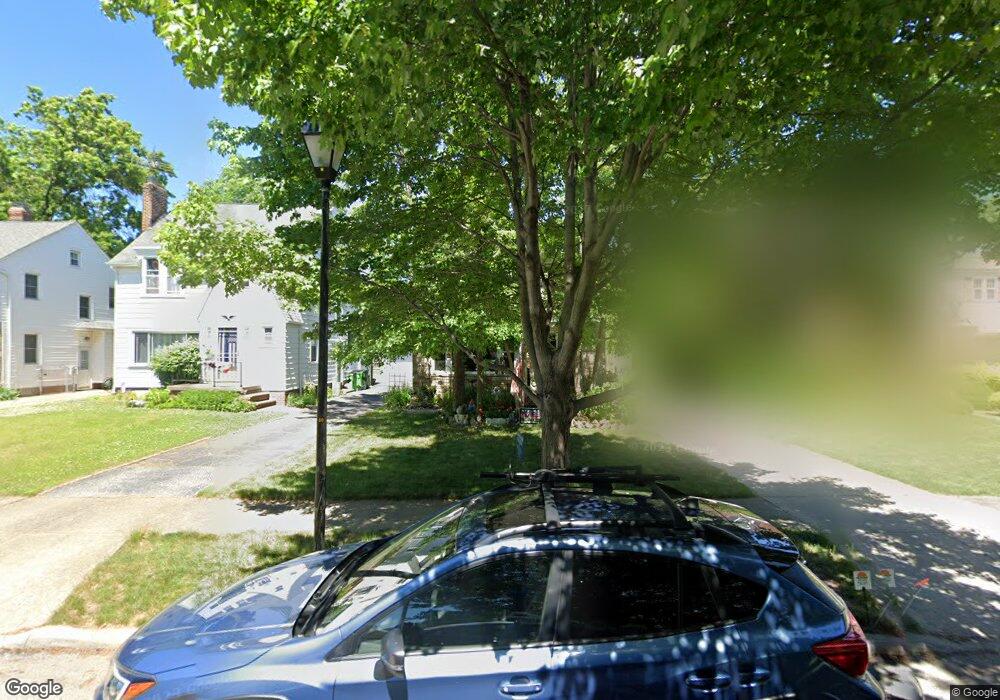
49 E 217th St Euclid, OH 44123
Estimated Value: $161,000 - $185,000
3
Beds
2
Baths
1,421
Sq Ft
$118/Sq Ft
Est. Value
About This Home
This home is located at 49 E 217th St, Euclid, OH 44123 and is currently estimated at $168,102, approximately $118 per square foot. 49 E 217th St is a home located in Cuyahoga County with nearby schools including Arbor Elementary School, Euclid Middle School, and Euclid High School.
Ownership History
Date
Name
Owned For
Owner Type
Purchase Details
Closed on
Jul 20, 2005
Sold by
Young Rebecca J
Bought by
Young Matthew and Young Rebecca J
Current Estimated Value
Home Financials for this Owner
Home Financials are based on the most recent Mortgage that was taken out on this home.
Original Mortgage
$147,000
Outstanding Balance
$74,374
Interest Rate
5.68%
Mortgage Type
New Conventional
Estimated Equity
$93,729
Purchase Details
Closed on
Nov 17, 2003
Sold by
Burns Kathleen A
Bought by
Young Rebecca J
Purchase Details
Closed on
Dec 30, 2002
Sold by
Nemeth Blanche L and Nemeth Frederick
Bought by
Burns Kathleen A
Purchase Details
Closed on
Apr 9, 2001
Sold by
Estate Of Blanche M Jonaitis
Bought by
Burns Kathleen A and Nemeth Blanche L
Purchase Details
Closed on
May 17, 1978
Sold by
Jonaitis Louis and Jonaitis Blanche
Bought by
Jonaitis Blanche M
Purchase Details
Closed on
Jan 1, 1975
Bought by
Jonaitis Louis and Jonaitis Blanche
Create a Home Valuation Report for This Property
The Home Valuation Report is an in-depth analysis detailing your home's value as well as a comparison with similar homes in the area
Home Values in the Area
Average Home Value in this Area
Purchase History
| Date | Buyer | Sale Price | Title Company |
|---|---|---|---|
| Young Matthew | -- | Public | |
| Young Rebecca J | -- | -- | |
| Burns Kathleen A | -- | -- | |
| Burns Kathleen A | -- | -- | |
| Jonaitis Blanche M | -- | -- | |
| Jonaitis Louis | -- | -- |
Source: Public Records
Mortgage History
| Date | Status | Borrower | Loan Amount |
|---|---|---|---|
| Open | Young Matthew | $147,000 |
Source: Public Records
Tax History
| Year | Tax Paid | Tax Assessment Tax Assessment Total Assessment is a certain percentage of the fair market value that is determined by local assessors to be the total taxable value of land and additions on the property. | Land | Improvement |
|---|---|---|---|---|
| 2025 | $3,294 | $49,525 | $11,095 | $38,430 |
| 2024 | $3,411 | $49,525 | $11,095 | $38,430 |
| 2023 | $3,602 | $42,040 | $9,170 | $32,870 |
| 2022 | $3,520 | $42,040 | $9,170 | $32,870 |
| 2021 | $3,929 | $42,040 | $9,170 | $32,870 |
| 2020 | $3,986 | $38,920 | $8,510 | $30,420 |
| 2019 | $3,588 | $111,200 | $24,300 | $86,900 |
| 2018 | $3,576 | $38,920 | $8,510 | $30,420 |
| 2017 | $3,831 | $34,380 | $7,250 | $27,130 |
| 2016 | $3,839 | $34,380 | $7,250 | $27,130 |
| 2015 | $3,491 | $34,380 | $7,250 | $27,130 |
| 2014 | $3,491 | $34,380 | $7,250 | $27,130 |
Source: Public Records
Map
Nearby Homes
- 94 E 217th St
- 170 E 220th St
- 226 E 216th St
- 336 E 222nd St
- 285 E 216th St
- 55 Sunnycliff Dr
- 144 E 208th St
- 324 E 215th St
- 461 Kenwood Dr Unit T3
- 421 Kenwood Dr Unit G
- 450 Kenwood Dr Unit D-12
- 273 E 208th St
- 422 Clearview Dr Unit J10
- 22751 Fox Ave
- 308 Buckner Dr Unit 204
- 521 Kenwood Dr Unit B-5
- 23298 Williams Ave
- 442 Clearview Dr Unit U9
- 324 E 235th St
- 71 E 201st St
Your Personal Tour Guide
Ask me questions while you tour the home.