Estimated Value: $521,000 - $577,000
2
Beds
3
Baths
1,092
Sq Ft
$501/Sq Ft
Est. Value
About This Home
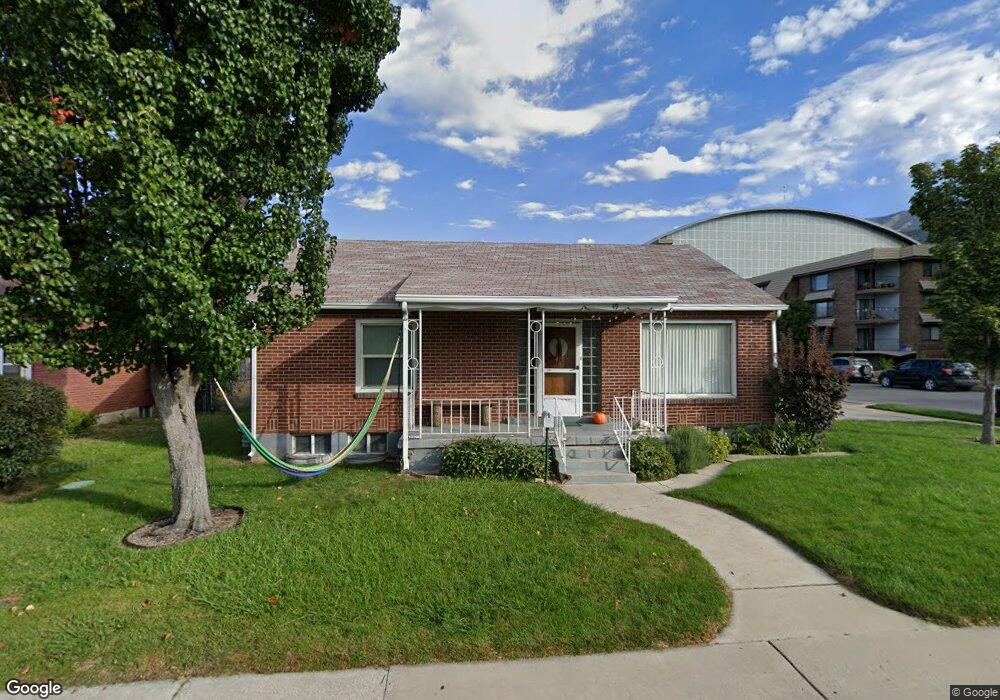
This home is located at 49 E 900 N, Provo, UT 84604 and is currently estimated at $547,025, approximately $500 per square foot. 49 E 900 N is a home located in Utah County with nearby schools including Provo Peaks School, Centennial Middle School, and Timpview High School.
Ownership History
Date
Name
Owned For
Owner Type
Purchase Details
Closed on
May 19, 2015
Sold by
Garrett Brian and Garrett Lisa
Bought by
49 E 900 N Property Llc
Current Estimated Value
Home Financials for this Owner
Home Financials are based on the most recent Mortgage that was taken out on this home.
Original Mortgage
$171,500
Outstanding Balance
$131,925
Interest Rate
3.64%
Mortgage Type
New Conventional
Estimated Equity
$415,100
Purchase Details
Closed on
Nov 19, 2014
Sold by
Garrett Properties Llc
Bought by
49 E 900 N Property Llc
Purchase Details
Closed on
Sep 17, 1996
Sold by
Garrett Russell W and Garrett Kathryn G
Bought by
Garrett Brian J and Garrett Lisa F
Home Financials for this Owner
Home Financials are based on the most recent Mortgage that was taken out on this home.
Original Mortgage
$95,000
Interest Rate
7.88%
Create a Home Valuation Report for This Property
The Home Valuation Report is an in-depth analysis detailing your home's value as well as a comparison with similar homes in the area
Purchase History
| Date | Buyer | Sale Price | Title Company |
|---|---|---|---|
| 49 E 900 N Property Llc | -- | Morgan Title & Escrow Inc | |
| Garrett Brian | -- | Morgan Title & Escrow Inc | |
| 49 E 900 N Property Llc | -- | None Available | |
| Garrett Brian J | -- | -- |
Source: Public Records
Mortgage History
| Date | Status | Borrower | Loan Amount |
|---|---|---|---|
| Open | Garrett Brian | $171,500 | |
| Closed | 49 E 900 N Property Llc | $171,500 | |
| Previous Owner | Garrett Brian J | $95,000 |
Source: Public Records
Tax History
| Year | Tax Paid | Tax Assessment Tax Assessment Total Assessment is a certain percentage of the fair market value that is determined by local assessors to be the total taxable value of land and additions on the property. | Land | Improvement |
|---|---|---|---|---|
| 2025 | $2,570 | $284,790 | -- | -- |
| 2024 | $2,570 | $252,945 | $0 | $0 |
| 2023 | $2,524 | $244,970 | $0 | $0 |
| 2022 | $2,730 | $267,080 | $0 | $0 |
| 2021 | $2,018 | $344,400 | $124,200 | $220,200 |
| 2020 | $1,957 | $313,100 | $112,900 | $200,200 |
| 2019 | $1,744 | $290,100 | $112,900 | $177,200 |
| 2018 | $1,604 | $270,600 | $106,600 | $164,000 |
| 2017 | $1,460 | $135,355 | $0 | $0 |
| 2016 | $1,228 | $106,150 | $0 | $0 |
| 2015 | $1,144 | $99,935 | $0 | $0 |
| 2014 | $1,094 | $99,660 | $0 | $0 |
Source: Public Records
Map
Nearby Homes
- 948 N 50 E Unit 301
- 747 N 200 E Unit 1
- 36 W 700 N Unit 206
- 620 N 100 St W
- 240 E 600 N
- 466 N 200 E
- 425 W 800 N
- 487 N 400 E
- 232 E 400 N
- 380 N 200 E
- 541 E 500 N Unit 12
- 556 W 800 N Unit 18
- 423 500 N Unit 10
- 659 N 700 E Unit 17
- 655 E 600 N Unit 6
- 246 N 200 E
- 810 N 600 W
- 737 E 750 N Unit 1
- 611 N 700 E Unit 5
- 194 N 100 E
Your Personal Tour Guide
Ask me questions while you tour the home.