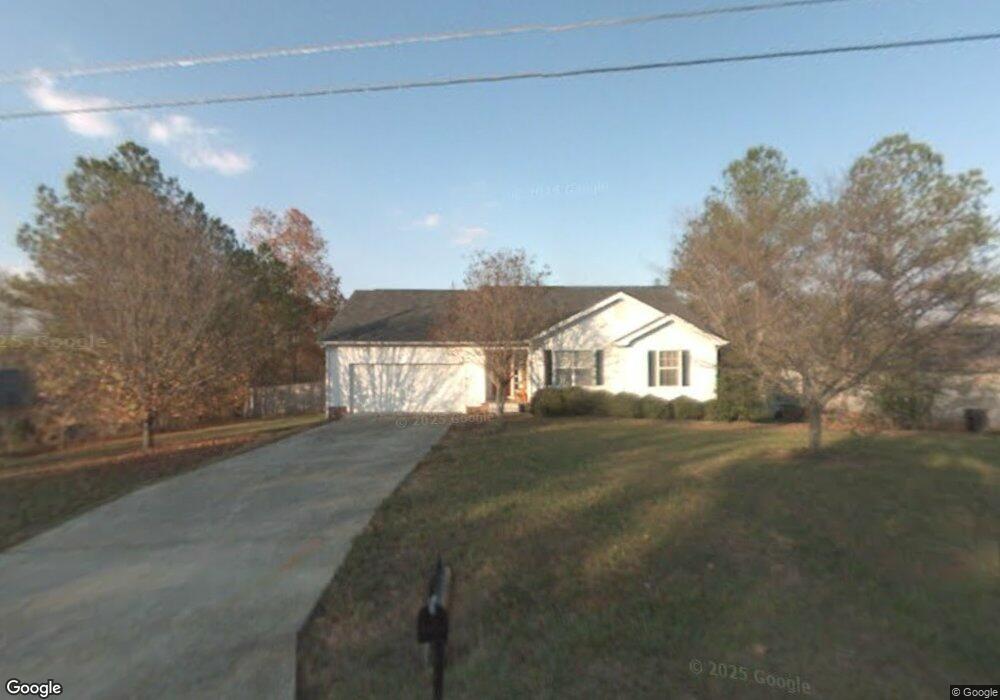
49 Ellis Ln Chatsworth, GA 30705
Estimated Value: $248,880 - $292,000
3
Beds
2
Baths
1,320
Sq Ft
$205/Sq Ft
Est. Value
About This Home
This home is located at 49 Ellis Ln, Chatsworth, GA 30705 and is currently estimated at $270,470, approximately $204 per square foot. 49 Ellis Ln is a home located in Murray County with nearby schools including Woodlawn Elementary School, Bagley Middle School, and North Murray High School.
Ownership History
Date
Name
Owned For
Owner Type
Purchase Details
Closed on
Jan 11, 2007
Sold by
Jp Morgan Chase Bank As T
Bought by
Hedden Jonathan Larry
Current Estimated Value
Purchase Details
Closed on
May 31, 2006
Sold by
Not Provided
Bought by
Christene Southern
Home Financials for this Owner
Home Financials are based on the most recent Mortgage that was taken out on this home.
Original Mortgage
$129,800
Interest Rate
6.51%
Mortgage Type
FHA
Purchase Details
Closed on
Oct 4, 2005
Sold by
Bailey Kenny
Bought by
Jpmorgan Chase Bank Trustee
Purchase Details
Closed on
Jun 13, 2003
Sold by
Lount Mandy B
Bought by
Bailey Kenny
Purchase Details
Closed on
Sep 14, 2001
Sold by
Jensen Jeffrey L and Jensen Kimberley M
Bought by
Lount Mandy B
Purchase Details
Closed on
Jan 12, 1996
Sold by
Leonard Jimmy A
Bought by
Jensen Jeffrey L
Purchase Details
Closed on
Feb 20, 1995
Sold by
Oxford John D
Bought by
Leonard Jimmy A
Create a Home Valuation Report for This Property
The Home Valuation Report is an in-depth analysis detailing your home's value as well as a comparison with similar homes in the area
Home Values in the Area
Average Home Value in this Area
Purchase History
| Date | Buyer | Sale Price | Title Company |
|---|---|---|---|
| Hedden Jonathan Larry | $108,000 | -- | |
| Christene Southern | $131,250 | -- | |
| Jpmorgan Chase Bank Trustee | $102,850 | -- | |
| Bailey Kenny | $115,000 | -- | |
| Lount Mandy B | $94,000 | -- | |
| Jensen Jeffrey L | $85,000 | -- | |
| Leonard Jimmy A | $8,000 | -- |
Source: Public Records
Mortgage History
| Date | Status | Borrower | Loan Amount |
|---|---|---|---|
| Previous Owner | Christene Southern | $129,800 |
Source: Public Records
Tax History Compared to Growth
Tax History
| Year | Tax Paid | Tax Assessment Tax Assessment Total Assessment is a certain percentage of the fair market value that is determined by local assessors to be the total taxable value of land and additions on the property. | Land | Improvement |
|---|---|---|---|---|
| 2024 | $2,328 | $98,976 | $6,000 | $92,976 |
| 2023 | $2,315 | $96,500 | $6,000 | $90,500 |
| 2022 | $2,015 | $83,980 | $6,000 | $77,980 |
| 2021 | $1,611 | $65,460 | $6,000 | $59,460 |
| 2020 | $1,390 | $56,500 | $6,000 | $50,500 |
| 2019 | $1,286 | $52,060 | $6,000 | $46,060 |
| 2018 | $1,286 | $52,060 | $6,000 | $46,060 |
| 2017 | $148 | $48,340 | $6,000 | $42,340 |
| 2016 | $943 | $41,532 | $6,000 | $35,532 |
| 2015 | -- | $39,892 | $6,000 | $33,892 |
| 2014 | -- | $39,892 | $6,000 | $33,892 |
| 2013 | -- | $42,692 | $8,800 | $33,892 |
Source: Public Records
Map
Nearby Homes
- 757 Ellis Cir
- 257 Ellis Cir
- 273 Ellis Cir
- 351 Valley Rd
- 308 Twin Lakes Rd
- 1594 Goswick Rd
- 557 McCamy Rd
- 4389 Georgia 225
- 214 Nassau Cir
- 567 Fullers Chapel Rd
- 5710 Hwy 255n
- 254 Fashion Cir
- 237 Windmill Dr
- 255 Norton Bridge Rd
- 359 Norton Bridge Rd
- 685 Goswick Rd
- 89 Arrowhead Dr
- 1800 Georgia 286
- 232 Brandon Cir
- 232 Brandon Cir Unit Lot 21