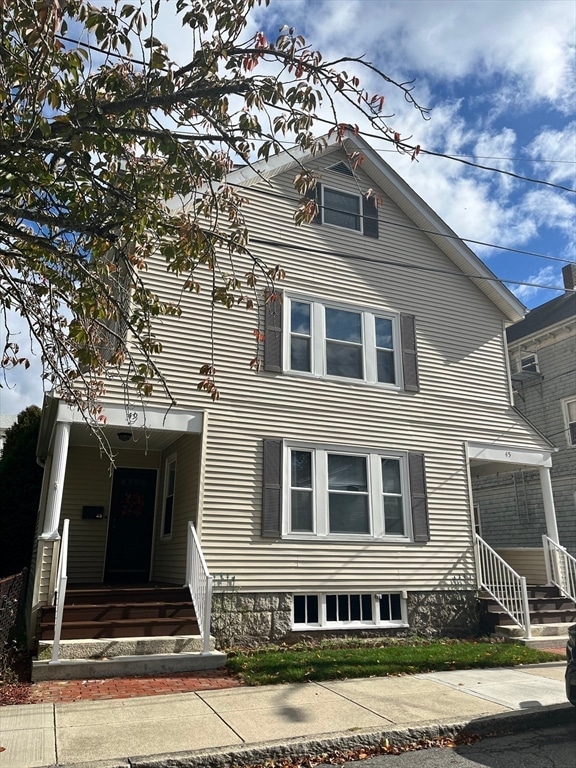
49 Farnham St Fall River, MA 02720
Highlands-Fall River NeighborhoodEstimated payment $4,189/month
Highlights
- City View
- Open Floorplan
- Home Office
- Granite Flooring
- Attic
- Skylights
About This Home
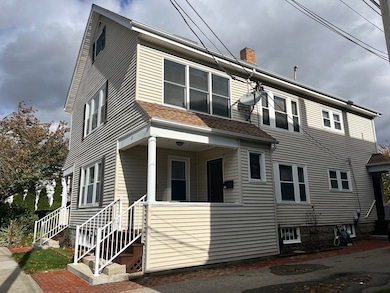
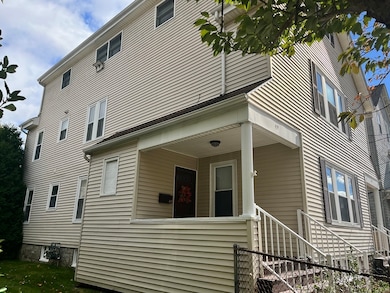
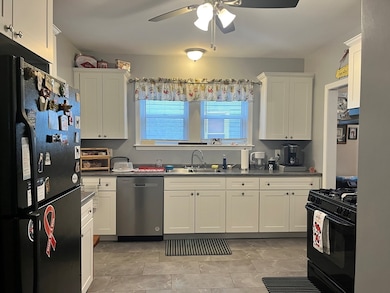
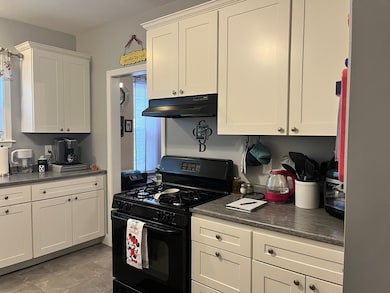
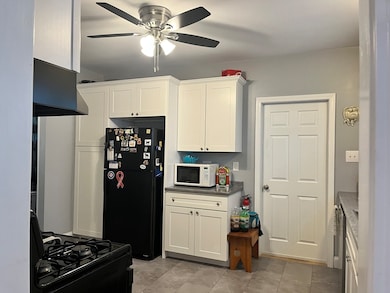
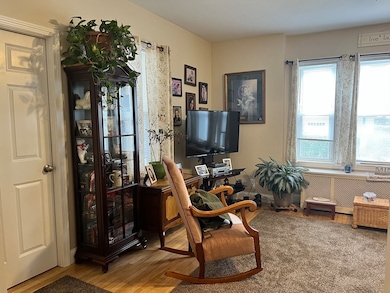
Discover this truly unique long-time family-owned 2-family home offering versatility, character, and space! The renovated first-floor unit features 2 bedrooms, an updated kitchen and bath, and inviting living areas — perfect for owner occupancy. The loft-style second-floor unit includes 3 bedrooms and 2 full baths, with the main bedroom suite showcasing a luxurious soaking tub, walk-in closet, and bonus family room,gym or home office. Additional features include a walk-up attic for storage, vinyl siding, a newer roof, and hot water heaters . Enjoy the great yard complete with a storage shed and a 20x14 carport— ideal for car storage. A rare find offering flexibility, comfort, and pride of ownership. A must-see for the owner-occupant or extended family!
Property Details
Home Type
- Multi-Family
Est. Annual Taxes
- $6,063
Year Built
- Built in 1925
Home Design
- Frame Construction
- Shingle Roof
Interior Spaces
- 2,876 Sq Ft Home
- Property has 1 Level
- Open Floorplan
- Ceiling Fan
- Skylights
- Living Room
- Dining Room
- Home Office
- Storage
- City Views
- Attic
Kitchen
- Range
- Dishwasher
- Disposal
Flooring
- Wood
- Carpet
- Granite
- Tile
Bedrooms and Bathrooms
- 5 Bedrooms
- Walk-In Closet
- 3 Full Bathrooms
- Bathtub with Shower
Parking
- 3 Car Parking Spaces
- Driveway
- Open Parking
- Off-Street Parking
Outdoor Features
- Shed
- Porch
Additional Features
- 4,748 Sq Ft Lot
- Central Heating
Community Details
- 2 Units
- Net Operating Income $16,800
Listing and Financial Details
- Rent includes unit 1(water)
- Assessor Parcel Number M:0P02 B:0000 L:0020,2834573
Map
Home Values in the Area
Average Home Value in this Area
Tax History
| Year | Tax Paid | Tax Assessment Tax Assessment Total Assessment is a certain percentage of the fair market value that is determined by local assessors to be the total taxable value of land and additions on the property. | Land | Improvement |
|---|---|---|---|---|
| 2025 | $6,063 | $529,500 | $131,900 | $397,600 |
| 2024 | $5,547 | $482,800 | $126,800 | $356,000 |
| 2023 | $5,076 | $413,700 | $113,900 | $299,800 |
| 2022 | $4,671 | $370,100 | $105,400 | $264,700 |
| 2021 | $4,579 | $331,100 | $99,600 | $231,500 |
| 2020 | $4,073 | $281,900 | $95,800 | $186,100 |
| 2019 | $3,912 | $268,300 | $95,800 | $172,500 |
| 2018 | $3,411 | $233,300 | $95,800 | $137,500 |
| 2017 | $2,999 | $214,200 | $95,800 | $118,400 |
| 2016 | $2,879 | $211,200 | $95,800 | $115,400 |
| 2015 | $2,681 | $205,000 | $89,600 | $115,400 |
| 2014 | $2,711 | $215,500 | $89,600 | $125,900 |
Property History
| Date | Event | Price | List to Sale | Price per Sq Ft |
|---|---|---|---|---|
| 11/03/2025 11/03/25 | For Sale | $699,000 | -- | $243 / Sq Ft |
Purchase History
| Date | Type | Sale Price | Title Company |
|---|---|---|---|
| Quit Claim Deed | -- | None Available | |
| Quit Claim Deed | -- | None Available | |
| Not Resolvable | $180,000 | None Available | |
| Quit Claim Deed | -- | -- | |
| Quit Claim Deed | -- | -- | |
| Deed | $54,500 | -- |
Mortgage History
| Date | Status | Loan Amount | Loan Type |
|---|---|---|---|
| Previous Owner | $220,000 | Purchase Money Mortgage | |
| Previous Owner | $25,000 | No Value Available |
Source: MLS Property Information Network (MLS PIN)
MLS Number: 73450713
APN: FALL-000002P-000000-000020
Disclaimer: Certain information contained herein is derived from information provided by parties other than Homes.com. All information provided is deemed reliable, but is not guaranteed to be accurate and should be independently verified.
![]() The property listing data and information, or the Images, set forth herein were provided to MLS Property Information Network, Inc. from third party sources, including sellers, lessors and public records, and were compiled by MLS Property Information Network, Inc. The property listing data and information, and the Images, are for the personal, non-commercial use of consumers having a good faith interest in purchasing or leasing listed properties of the type displayed to them and may not be used for any purpose other than to identify prospective properties which such consumers may have a good faith interest in purchasing or leasing. MLS Property Information Network, Inc. and its subscribers disclaim any and all representations and warranties as to the accuracy of the property listing data and information, or as to the accuracy of any of the Images, set forth herein.
The property listing data and information, or the Images, set forth herein were provided to MLS Property Information Network, Inc. from third party sources, including sellers, lessors and public records, and were compiled by MLS Property Information Network, Inc. The property listing data and information, and the Images, are for the personal, non-commercial use of consumers having a good faith interest in purchasing or leasing listed properties of the type displayed to them and may not be used for any purpose other than to identify prospective properties which such consumers may have a good faith interest in purchasing or leasing. MLS Property Information Network, Inc. and its subscribers disclaim any and all representations and warranties as to the accuracy of the property listing data and information, or as to the accuracy of any of the Images, set forth herein.
- 342 Stetson St
- 108 Garden St
- 884-886 Robeson St
- 270 Garden St
- 147 Stetson St
- 65 Bigelow St
- 69 Summerfield St
- 153 Ray St
- 101 Primrose St
- 545 Robeson St
- 1268 President Ave
- 503 Highland Ave
- 37 Shawmut St
- 808 Walnut St
- 499 Madison St
- 862 Locust St
- 770 Locust St
- 1353 Robeson St
- 847 Locust St
- 72 Belmont St
- 269 Stetson St Unit 3
- 270 Stetson St Unit 3
- 967 Robeson St Unit 2
- 136 New Boston Rd
- 9 Adams Ct
- 130 Underwood St Unit 1
- 57 Colfax St Unit 63
- 52 Underwood St Unit Suite B
- 468 Linden St Unit 2
- 341 Belmont St Unit 1
- 177 Highland Ave Unit 1
- 638 Locust St Unit 2
- 235 Tremont St Unit 1E
- 216 Tremont St Unit 2E
- 764 Rock St Unit 2
- 160 Robeson St Unit 3
- 466 Locust St Unit 2
- 93 Grove St Unit 1R
- 160 Seabury St
- 322 Brownell St Unit 3W
