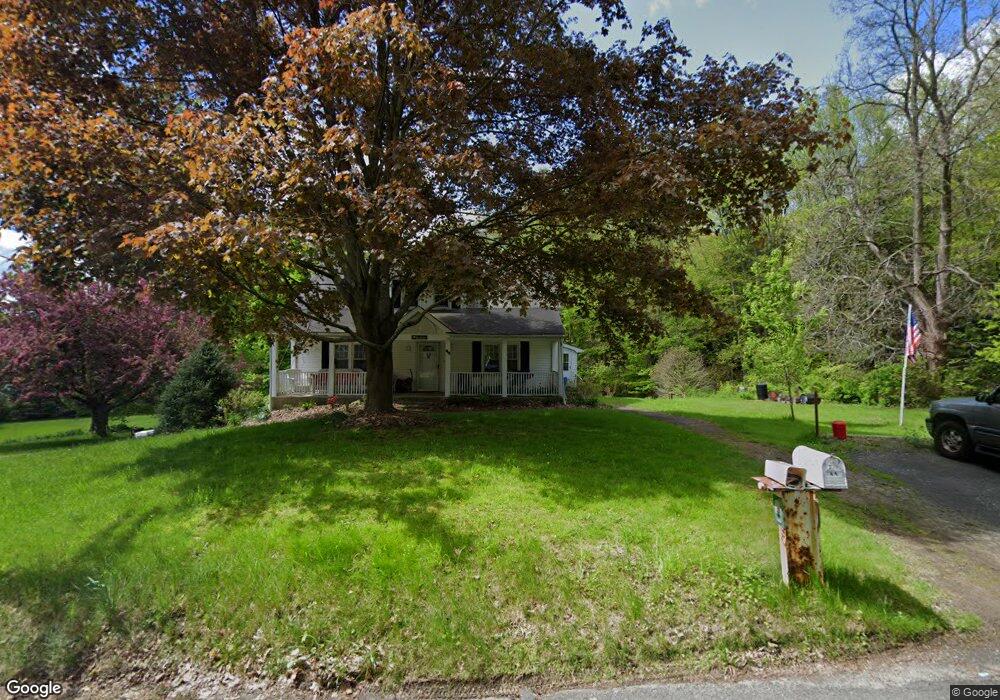
49 Fenn Rd Thomaston, CT 06787
Estimated Value: $391,000 - $452,000
3
Beds
2
Baths
1,828
Sq Ft
$232/Sq Ft
Est. Value
About This Home
This home is located at 49 Fenn Rd, Thomaston, CT 06787 and is currently estimated at $424,880, approximately $232 per square foot. 49 Fenn Rd is a home located in Litchfield County with nearby schools including Black Rock School, Thomaston Center School, and Thomaston High School.
Ownership History
Date
Name
Owned For
Owner Type
Purchase Details
Closed on
Nov 30, 2001
Sold by
Hernandez Roy and Hernandez Laura
Bought by
Passeck Jeff and Passeck Christine
Current Estimated Value
Home Financials for this Owner
Home Financials are based on the most recent Mortgage that was taken out on this home.
Original Mortgage
$160,000
Outstanding Balance
$62,938
Interest Rate
6.66%
Estimated Equity
$361,942
Purchase Details
Closed on
May 29, 1992
Sold by
Rogozinski Paul A
Bought by
Hernandez Roy and Bonenfant Laura
Create a Home Valuation Report for This Property
The Home Valuation Report is an in-depth analysis detailing your home's value as well as a comparison with similar homes in the area
Home Values in the Area
Average Home Value in this Area
Purchase History
| Date | Buyer | Sale Price | Title Company |
|---|---|---|---|
| Passeck Jeff | $209,000 | -- | |
| Hernandez Roy | $124,000 | -- |
Source: Public Records
Mortgage History
| Date | Status | Borrower | Loan Amount |
|---|---|---|---|
| Closed | Hernandez Roy | $49,200 | |
| Open | Hernandez Roy | $77,431 | |
| Open | Hernandez Roy | $160,000 |
Source: Public Records
Tax History Compared to Growth
Tax History
| Year | Tax Paid | Tax Assessment Tax Assessment Total Assessment is a certain percentage of the fair market value that is determined by local assessors to be the total taxable value of land and additions on the property. | Land | Improvement |
|---|---|---|---|---|
| 2025 | $6,202 | $173,180 | $65,870 | $107,310 |
| 2024 | $5,950 | $173,180 | $65,870 | $107,310 |
| 2023 | $5,824 | $173,180 | $65,870 | $107,310 |
| 2022 | $5,561 | $173,180 | $65,870 | $107,310 |
| 2021 | $83 | $145,600 | $65,870 | $79,730 |
| 2020 | $90 | $145,600 | $65,870 | $79,730 |
| 2019 | $5,319 | $145,600 | $65,870 | $79,730 |
| 2018 | $5,211 | $145,600 | $65,870 | $79,730 |
| 2017 | $5,103 | $145,600 | $65,870 | $79,730 |
| 2016 | $5,123 | $150,360 | $62,650 | $87,710 |
| 2015 | $5,057 | $150,360 | $62,650 | $87,710 |
| 2014 | $5,057 | $150,360 | $62,650 | $87,710 |
Source: Public Records
Map
Nearby Homes