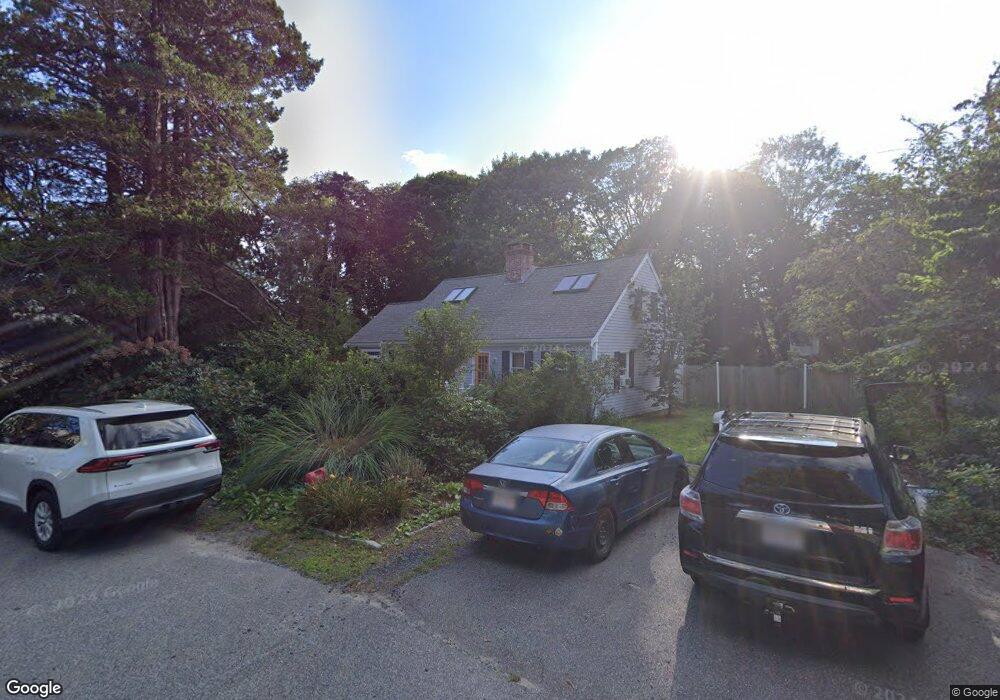
49 Gull Rd Falmouth, MA 02540
Falmouth Village NeighborhoodEstimated Value: $1,024,000 - $1,398,000
4
Beds
2
Baths
1,889
Sq Ft
$649/Sq Ft
Est. Value
About This Home
This home is located at 49 Gull Rd, Falmouth, MA 02540 and is currently estimated at $1,225,050, approximately $648 per square foot. 49 Gull Rd is a home located in Barnstable County with nearby schools including Mullen-Hall School, Lawrence School, and Morse Pond School.
Ownership History
Date
Name
Owned For
Owner Type
Purchase Details
Closed on
Jul 15, 2004
Sold by
Obrien Carol A and Mello Patricia J
Bought by
Mclean Colleen and Mclean Sean P
Current Estimated Value
Home Financials for this Owner
Home Financials are based on the most recent Mortgage that was taken out on this home.
Original Mortgage
$392,000
Outstanding Balance
$196,221
Interest Rate
6.25%
Mortgage Type
Purchase Money Mortgage
Estimated Equity
$1,028,829
Create a Home Valuation Report for This Property
The Home Valuation Report is an in-depth analysis detailing your home's value as well as a comparison with similar homes in the area
Home Values in the Area
Average Home Value in this Area
Purchase History
| Date | Buyer | Sale Price | Title Company |
|---|---|---|---|
| Mclean Colleen | $490,000 | -- |
Source: Public Records
Mortgage History
| Date | Status | Borrower | Loan Amount |
|---|---|---|---|
| Open | Mclean Colleen | $392,000 |
Source: Public Records
Tax History Compared to Growth
Tax History
| Year | Tax Paid | Tax Assessment Tax Assessment Total Assessment is a certain percentage of the fair market value that is determined by local assessors to be the total taxable value of land and additions on the property. | Land | Improvement |
|---|---|---|---|---|
| 2025 | $5,829 | $993,100 | $494,900 | $498,200 |
| 2024 | $5,696 | $907,000 | $450,000 | $457,000 |
| 2023 | $5,301 | $766,000 | $372,400 | $393,600 |
| 2022 | $5,221 | $648,600 | $327,300 | $321,300 |
| 2021 | $5,188 | $610,300 | $327,300 | $283,000 |
| 2020 | $4,987 | $580,600 | $297,600 | $283,000 |
| 2019 | $4,912 | $573,800 | $297,600 | $276,200 |
| 2018 | $4,801 | $558,300 | $297,600 | $260,700 |
| 2017 | $4,523 | $530,300 | $297,600 | $232,700 |
| 2016 | $4,439 | $530,300 | $297,600 | $232,700 |
| 2015 | $4,343 | $530,300 | $297,600 | $232,700 |
| 2014 | $4,307 | $528,500 | $297,500 | $231,000 |
Source: Public Records
Map
Nearby Homes
- 15 Hedge Ln
- 65 Walker St
- 71 Main St
- 98 Main St
- 98 Main St Unit 1
- 30 Katherine Lee Bates Rd
- 38 Landfall Unit 38
- 38 Landfall
- 33 Oakwood Ave
- 480 Main St Unit 1
- 87 Oyster Pond Rd
- 110 Dillingham Ave Unit 322
- 253 Scranton Ave
- 251 Woods Hole Rd
- 354 Gifford St Unit 5
- 354 Gifford St Unit 2
- 354 Gifford St Unit 6
- 45 Haynes Ave
- 9 Fairmount Ave Unit 1
- 9 Fairmount Ave