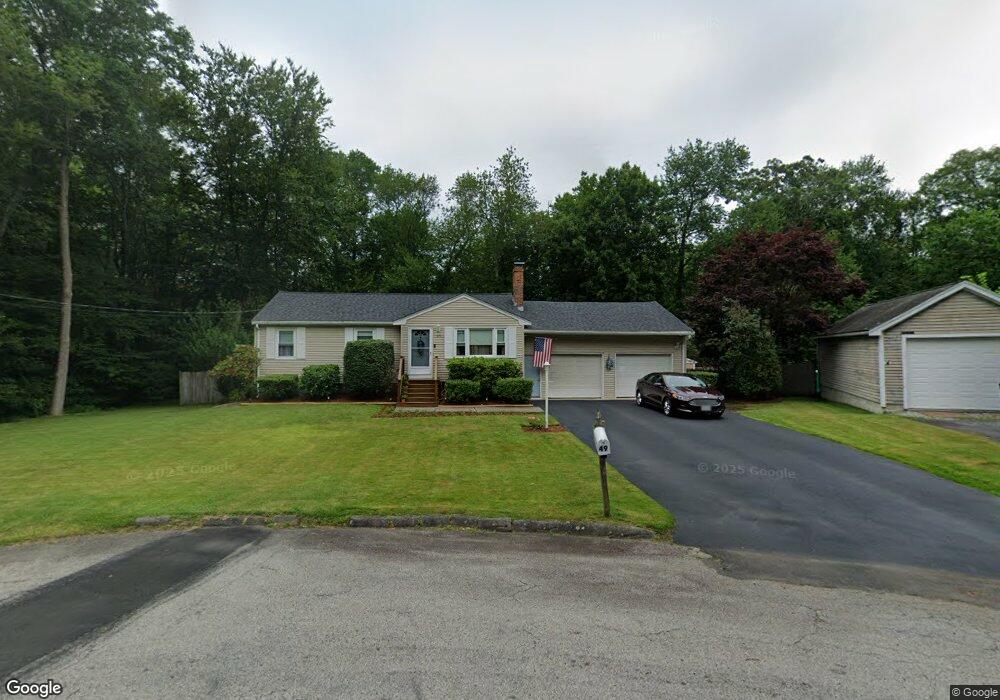
49 Harton Ross Dr Whitman, MA 02382
Estimated Value: $510,000 - $641,000
3
Beds
2
Baths
1,270
Sq Ft
$440/Sq Ft
Est. Value
About This Home
This home is located at 49 Harton Ross Dr, Whitman, MA 02382 and is currently estimated at $559,333, approximately $440 per square foot. 49 Harton Ross Dr is a home located in Plymouth County with nearby schools including St Bridget School.
Ownership History
Date
Name
Owned For
Owner Type
Purchase Details
Closed on
Jun 10, 1994
Sold by
Jablonski David A and Jablonski Susan R
Bought by
Sullivan Brian T and Thiessen Kathleen M
Current Estimated Value
Home Financials for this Owner
Home Financials are based on the most recent Mortgage that was taken out on this home.
Original Mortgage
$114,000
Interest Rate
8.29%
Mortgage Type
Purchase Money Mortgage
Create a Home Valuation Report for This Property
The Home Valuation Report is an in-depth analysis detailing your home's value as well as a comparison with similar homes in the area
Home Values in the Area
Average Home Value in this Area
Purchase History
| Date | Buyer | Sale Price | Title Company |
|---|---|---|---|
| Sullivan Brian T | $126,875 | -- |
Source: Public Records
Mortgage History
| Date | Status | Borrower | Loan Amount |
|---|---|---|---|
| Open | Sullivan Brian T | $150,000 | |
| Closed | Sullivan Brian T | $103,200 | |
| Closed | Sullivan Brian T | $103,200 | |
| Closed | Sullivan Brian T | $114,000 |
Source: Public Records
Tax History Compared to Growth
Tax History
| Year | Tax Paid | Tax Assessment Tax Assessment Total Assessment is a certain percentage of the fair market value that is determined by local assessors to be the total taxable value of land and additions on the property. | Land | Improvement |
|---|---|---|---|---|
| 2025 | $6,610 | $503,800 | $206,900 | $296,900 |
| 2024 | $5,997 | $470,700 | $196,200 | $274,500 |
| 2023 | $6,052 | $446,000 | $187,700 | $258,300 |
| 2022 | $5,910 | $405,900 | $170,600 | $235,300 |
| 2021 | $5,799 | $374,100 | $160,000 | $214,100 |
| 2020 | $5,563 | $351,000 | $149,300 | $201,700 |
| 2019 | $5,180 | $336,800 | $149,300 | $187,500 |
| 2018 | $4,870 | $304,200 | $134,400 | $169,800 |
| 2017 | $4,587 | $304,200 | $134,400 | $169,800 |
| 2016 | $4,420 | $283,500 | $133,300 | $150,200 |
| 2015 | $4,425 | $283,500 | $133,300 | $150,200 |
Source: Public Records
Map
Nearby Homes
- 300 High St
- 66 Belmont St
- 1098 Bedford St
- 360 High St
- 164 Warren Ave
- 135-137 Temple St
- 63 Dewey Ave
- 604 Bedford St Unit 5
- 4 Locust Hill Ln
- 53 Temple St
- 551 Bedford St Unit B4
- 63 Rice St
- 78 Linda St
- 532 Washington St
- 277 School St
- 262 Homeland Dr
- 14 Doris Dr
- 110 South Ave Unit 14
- 11 Glenwood St
- 63 Allen St