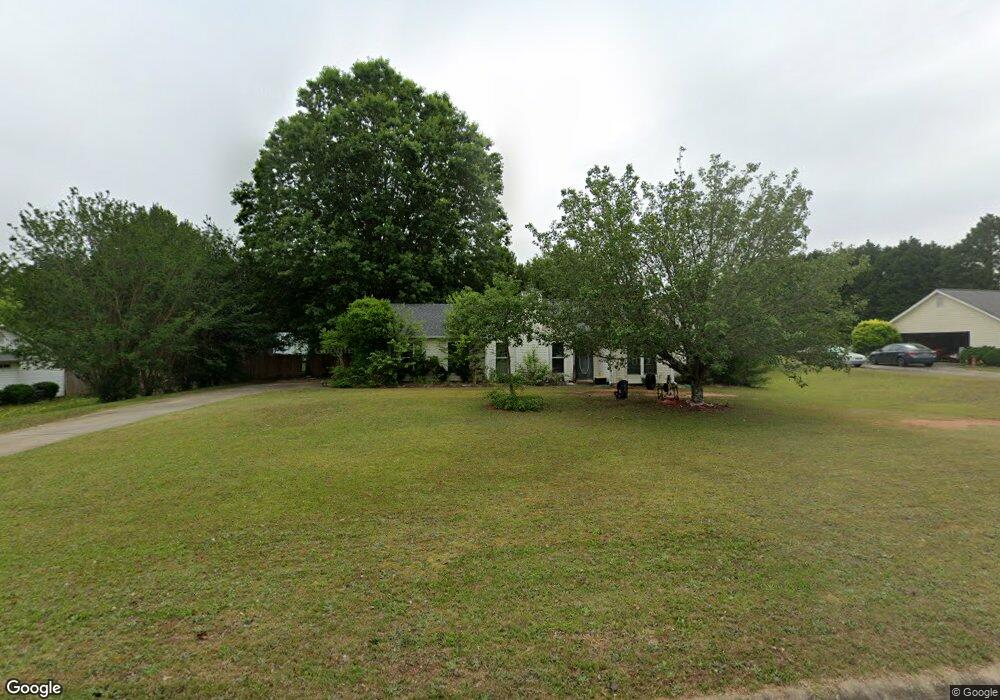
49 Hayward Bishop Way Senoia, GA 30276
Estimated Value: $258,188 - $310,000
3
Beds
2
Baths
1,040
Sq Ft
$280/Sq Ft
Est. Value
About This Home
This home is located at 49 Hayward Bishop Way, Senoia, GA 30276 and is currently estimated at $290,797, approximately $279 per square foot. 49 Hayward Bishop Way is a home located in Coweta County with nearby schools including Poplar Road Elementary School, East Coweta Middle School, and East Coweta High School.
Ownership History
Date
Name
Owned For
Owner Type
Purchase Details
Closed on
Apr 28, 2005
Sold by
Oliver Sydnor S and Oliver Barbara
Bought by
Carothers Stephen S
Current Estimated Value
Home Financials for this Owner
Home Financials are based on the most recent Mortgage that was taken out on this home.
Original Mortgage
$131,500
Outstanding Balance
$69,224
Interest Rate
5.99%
Mortgage Type
New Conventional
Estimated Equity
$221,573
Purchase Details
Closed on
Jan 4, 2005
Sold by
White Dorothy S
Bought by
Oliver Barbara S and Oliver Sydnor
Purchase Details
Closed on
Aug 9, 1996
Sold by
Lindsey Homes
Bought by
Lyle Andy Christi
Purchase Details
Closed on
Feb 22, 1996
Bought by
David Lindsey Homes
Purchase Details
Closed on
Oct 7, 1993
Bought by
Regional Atlanta Dev
Purchase Details
Closed on
Nov 30, 1983
Bought by
Mcknight P R
Create a Home Valuation Report for This Property
The Home Valuation Report is an in-depth analysis detailing your home's value as well as a comparison with similar homes in the area
Home Values in the Area
Average Home Value in this Area
Purchase History
| Date | Buyer | Sale Price | Title Company |
|---|---|---|---|
| Carothers Stephen S | $131,500 | -- | |
| Oliver Barbara S | $97,100 | -- | |
| Oliver Barbara S | -- | -- | |
| Lyle Andy Christi | $77,700 | -- | |
| David Lindsey Homes | $135,000 | -- | |
| Regional Atlanta Dev | $275,700 | -- | |
| Mcknight P R | -- | -- |
Source: Public Records
Mortgage History
| Date | Status | Borrower | Loan Amount |
|---|---|---|---|
| Open | Carothers Stephen S | $131,500 | |
| Closed | Lyle Andy Christi | $0 |
Source: Public Records
Tax History Compared to Growth
Tax History
| Year | Tax Paid | Tax Assessment Tax Assessment Total Assessment is a certain percentage of the fair market value that is determined by local assessors to be the total taxable value of land and additions on the property. | Land | Improvement |
|---|---|---|---|---|
| 2024 | $2,038 | $92,387 | $24,000 | $68,387 |
| 2023 | $2,038 | $84,783 | $20,000 | $64,783 |
| 2022 | $1,716 | $74,360 | $20,000 | $54,360 |
| 2021 | $1,446 | $59,588 | $16,000 | $43,588 |
| 2020 | $1,366 | $56,261 | $16,000 | $40,261 |
| 2019 | $1,310 | $49,549 | $10,000 | $39,549 |
| 2018 | $1,313 | $49,549 | $10,000 | $39,549 |
| 2017 | $1,213 | $46,159 | $10,000 | $36,159 |
| 2016 | $1,127 | $43,616 | $10,000 | $33,616 |
| 2015 | $1,038 | $41,074 | $10,000 | $31,074 |
| 2014 | $752 | $36,249 | $8,000 | $28,249 |
Source: Public Records
Map
Nearby Homes
- 25 Peeks Ct
- 525 Hayward Bishop Way
- 909 Lawshe Rd
- 40 Owens Path
- 15 Fieldstone Farms Dr
- 752 Lawshe Rd
- 130 Putney Way
- 45 Cushing St Unit 156
- 129 Rutland Ct
- 350 Cushing St
- 300 Kenwood Trail
- 275 Kenwood Trail
- 245 Kenwood Trail
- 150 Duck Dr
- 95 Old Mill Way Unit 2
- 1907 Standing Rock Rd
- 135 Old Mill Way Unit 4
- 215 Duck Dr
- 800 Rock House Rd
- 2022 Standing Rock Rd
- 53 Hayward Bishop Way
- 39 Hayward Bishop Way
- 63 Hayward Bishop Way
- 191 Peeks Crossing Dr Unit 36
- 191 Peeks Crossing Dr
- 46 Hayward Bishop Way
- 52 Hayward Bishop Way
- 167 Peeks Crossing Dr Unit 1
- 207 Peeks Crossing Dr
- 56 Hayward Bishop Way
- 155 Peeks Crossing Dr Unit 3
- 74 Hayward Bishop Way
- 85 Hayward Bishop Way
- 196 Peeks Crossing Dr
- 225 Peeks Crossing Dr
- 174 Peeks Crossing Dr
- 218 Peeks Crossing Dr
- 35 Laura Way
- 45 Laura Way
- 95 Hayward Bishop Way