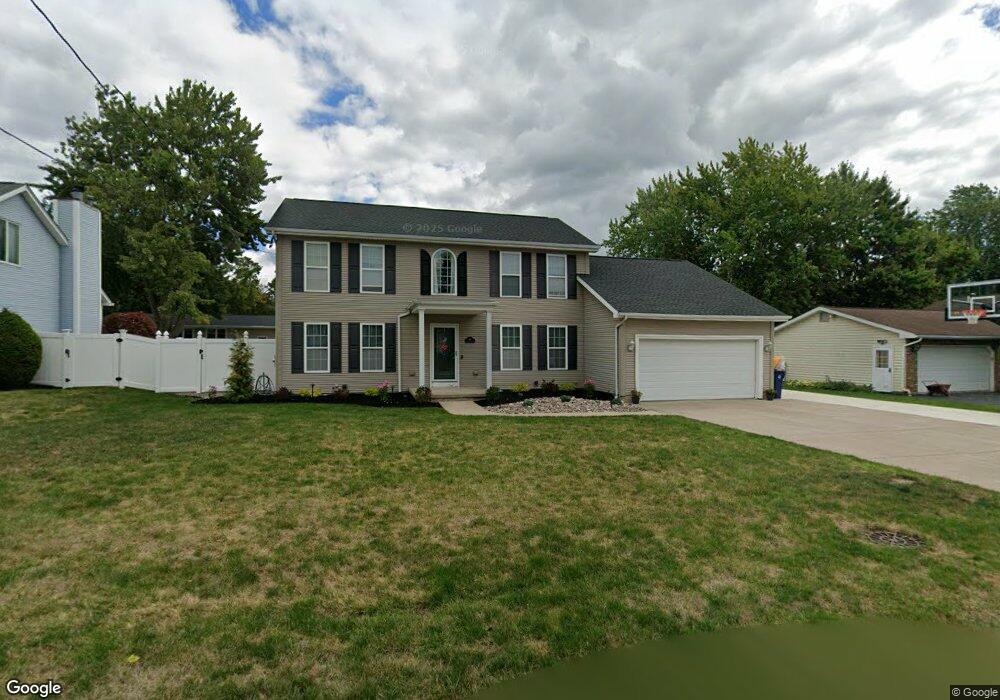
49 Hi Point Dr Lockport, NY 14094
Estimated Value: $318,000 - $399,000
4
Beds
3
Baths
2,012
Sq Ft
$183/Sq Ft
Est. Value
About This Home
This home is located at 49 Hi Point Dr, Lockport, NY 14094 and is currently estimated at $367,406, approximately $182 per square foot. 49 Hi Point Dr is a home located in Niagara County with nearby schools including Aaron Mossell Junior High School, Lockport High School, and DeSales Catholic School.
Ownership History
Date
Name
Owned For
Owner Type
Purchase Details
Closed on
Oct 8, 2010
Sold by
Cook Keith R and Cook Melissa J
Bought by
Cain Kevin A and Cain Krista A
Current Estimated Value
Home Financials for this Owner
Home Financials are based on the most recent Mortgage that was taken out on this home.
Original Mortgage
$172,900
Outstanding Balance
$114,328
Interest Rate
4.39%
Mortgage Type
New Conventional
Estimated Equity
$253,078
Purchase Details
Closed on
Apr 29, 2005
Sold by
Runfola Joseph
Bought by
Cook Keith
Purchase Details
Closed on
Feb 20, 2003
Sold by
Hildreth Thomas
Bought by
Runfola Joseph
Purchase Details
Closed on
Aug 19, 2002
Sold by
Solotes Wayne A
Bought by
Hildreth Thomas R
Purchase Details
Closed on
Oct 12, 2001
Sold by
Chapman Esther L
Bought by
Solotes Wayne A
Purchase Details
Closed on
Aug 25, 1997
Sold by
Tagg Tillie
Bought by
Chapman Esther L
Create a Home Valuation Report for This Property
The Home Valuation Report is an in-depth analysis detailing your home's value as well as a comparison with similar homes in the area
Home Values in the Area
Average Home Value in this Area
Purchase History
| Date | Buyer | Sale Price | Title Company |
|---|---|---|---|
| Cain Kevin A | $182,000 | None Available | |
| Cook Keith | $180,000 | Michael Rakowski | |
| Runfola Joseph | $162,740 | David Natemeir | |
| Hildreth Thomas R | $15,000 | Walter E Jr Moxham | |
| Solotes Wayne A | $14,000 | John Ottaviano | |
| Chapman Esther L | $7,600 | -- |
Source: Public Records
Mortgage History
| Date | Status | Borrower | Loan Amount |
|---|---|---|---|
| Open | Cain Kevin A | $172,900 |
Source: Public Records
Tax History Compared to Growth
Tax History
| Year | Tax Paid | Tax Assessment Tax Assessment Total Assessment is a certain percentage of the fair market value that is determined by local assessors to be the total taxable value of land and additions on the property. | Land | Improvement |
|---|---|---|---|---|
| 2024 | $8,371 | $308,000 | $11,500 | $296,500 |
| 2023 | $8,052 | $288,000 | $11,500 | $276,500 |
| 2022 | $6,431 | $257,000 | $11,500 | $245,500 |
| 2021 | $7,149 | $181,300 | $9,700 | $171,600 |
| 2020 | $6,995 | $181,300 | $9,700 | $171,600 |
| 2019 | $4,302 | $181,300 | $9,700 | $171,600 |
| 2018 | $4,341 | $181,300 | $9,700 | $171,600 |
| 2017 | $4,302 | $181,300 | $9,700 | $171,600 |
| 2016 | $4,115 | $181,300 | $9,700 | $171,600 |
| 2015 | -- | $181,300 | $9,700 | $171,600 |
| 2014 | -- | $181,300 | $9,700 | $171,600 |
Source: Public Records
Map
Nearby Homes
- 55 Hi Point Dr
- 43 Hi Point Dr
- 24 Roosevelt Dr
- 22 Roosevelt Dr
- 26 Roosevelt Dr
- 46 Hi Point Dr
- 54 Hi Point Dr
- 61 Hi Point Dr
- 37 Hi Point Dr
- 16 Roosevelt Dr
- 28 Roosevelt Dr
- 38 Hi Point Dr
- 38 Hi Point Dr
- 62 Hi Point Dr
- 67 Hi Point Dr
- 14 Roosevelt Dr
- 31 Hi Point Dr
- 30 Roosevelt Dr
- 72 Hi Point Dr
- 23 Roosevelt Dr