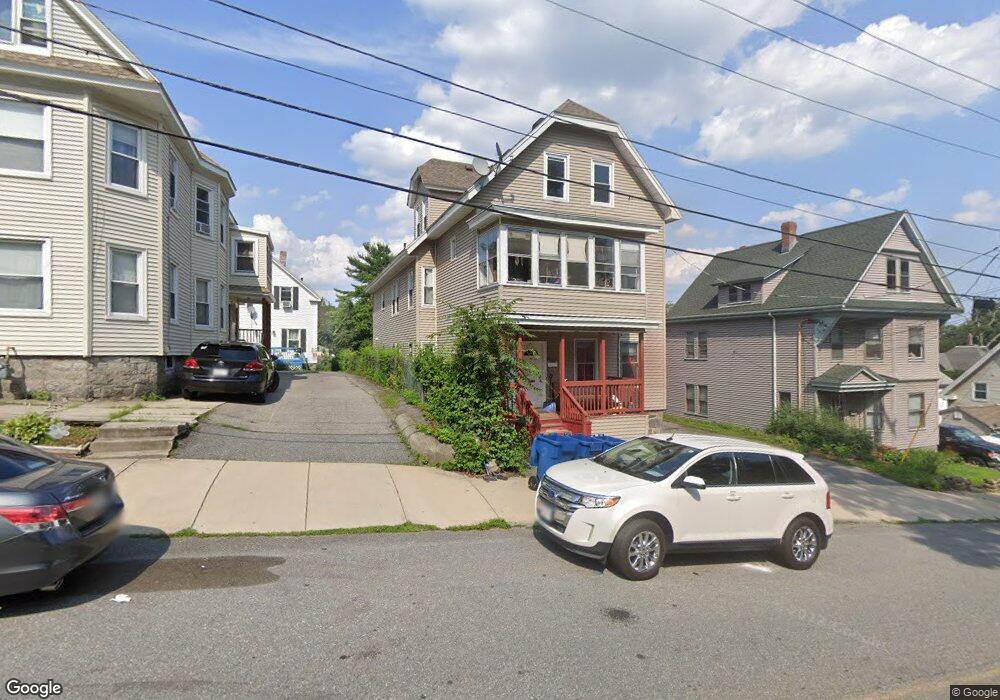
49 High St Unit 49A Lawrence, MA 01841
Prospect Hill-Back Bay NeighborhoodEstimated Value: $605,000 - $918,000
2
Beds
1
Bath
750
Sq Ft
$1,051/Sq Ft
Est. Value
About This Home
This home is located at 49 High St Unit 49A, Lawrence, MA 01841 and is currently estimated at $788,000, approximately $1,050 per square foot. 49 High St Unit 49A is a home located in Essex County with nearby schools including Olive Branch Elementary School, James F. Hennessey School, and School For Exceptional Studies.
Ownership History
Date
Name
Owned For
Owner Type
Purchase Details
Closed on
May 27, 2015
Sold by
Cherubin Ft and Klisiewicz Ewa
Bought by
Montminy Ryan R and Montminy Urszula E
Current Estimated Value
Home Financials for this Owner
Home Financials are based on the most recent Mortgage that was taken out on this home.
Original Mortgage
$183,150
Outstanding Balance
$145,066
Interest Rate
4.4%
Mortgage Type
FHA
Estimated Equity
$642,934
Create a Home Valuation Report for This Property
The Home Valuation Report is an in-depth analysis detailing your home's value as well as a comparison with similar homes in the area
Home Values in the Area
Average Home Value in this Area
Purchase History
| Date | Buyer | Sale Price | Title Company |
|---|---|---|---|
| Montminy Ryan R | -- | -- |
Source: Public Records
Mortgage History
| Date | Status | Borrower | Loan Amount |
|---|---|---|---|
| Open | Montminy Ryan R | $183,150 |
Source: Public Records
Tax History Compared to Growth
Tax History
| Year | Tax Paid | Tax Assessment Tax Assessment Total Assessment is a certain percentage of the fair market value that is determined by local assessors to be the total taxable value of land and additions on the property. | Land | Improvement |
|---|---|---|---|---|
| 2025 | $6,802 | $772,900 | $156,000 | $616,900 |
| 2024 | $6,865 | $742,200 | $150,800 | $591,400 |
| 2023 | $6,299 | $620,000 | $130,000 | $490,000 |
| 2022 | $5,769 | $504,300 | $120,600 | $383,700 |
| 2021 | $5,474 | $446,100 | $120,600 | $325,500 |
| 2020 | $5,245 | $422,000 | $96,700 | $325,300 |
| 2019 | $5,546 | $405,400 | $100,000 | $305,400 |
| 2018 | $4,973 | $347,300 | $91,000 | $256,300 |
| 2017 | $4,469 | $291,300 | $90,000 | $201,300 |
| 2016 | $4,036 | $260,200 | $60,000 | $200,200 |
| 2015 | $3,788 | $250,500 | $60,000 | $190,500 |
Source: Public Records
Map
Nearby Homes
- 7 Stevens Ct
- 52 Howard St
- 19-21 Pleasant Terrace
- 42 Union St
- 80 Ferry St Unit 80A
- 4 Shawsheen Rd Unit 2
- 32 Orchard St
- 80 Market St
- 6 Brook St
- 89 Newbury St Unit 89B
- 46 Loring St
- 75 Beverly St Unit 75
- 65 Brook St
- 192 Union St
- 68 Union St
- 64 Salem St
- 317 Middlesex St
- 77-79 Shawsheen Rd
- 127 Marblehead St Unit A
- 100-102 E Haverhill St
- 49 High St Unit B
- 49-4 High St Unit 3
- 49 High St Unit 3
- 49 High St Unit 1
- 47 High St
- 51 High St Unit 55
- 51-55 High St
- 57 High St
- 57 High St Unit 2
- 47 Storrow St
- 39 Storrow St
- 61 High St
- 61 High St Unit 3
- 1-3 Storrow Terrace
- 37 Storrow St
- 120 Allston St Unit 122
- 31 Storrow St
- 128 Allston St
- 118 Allston St
- 120-122 Allston St