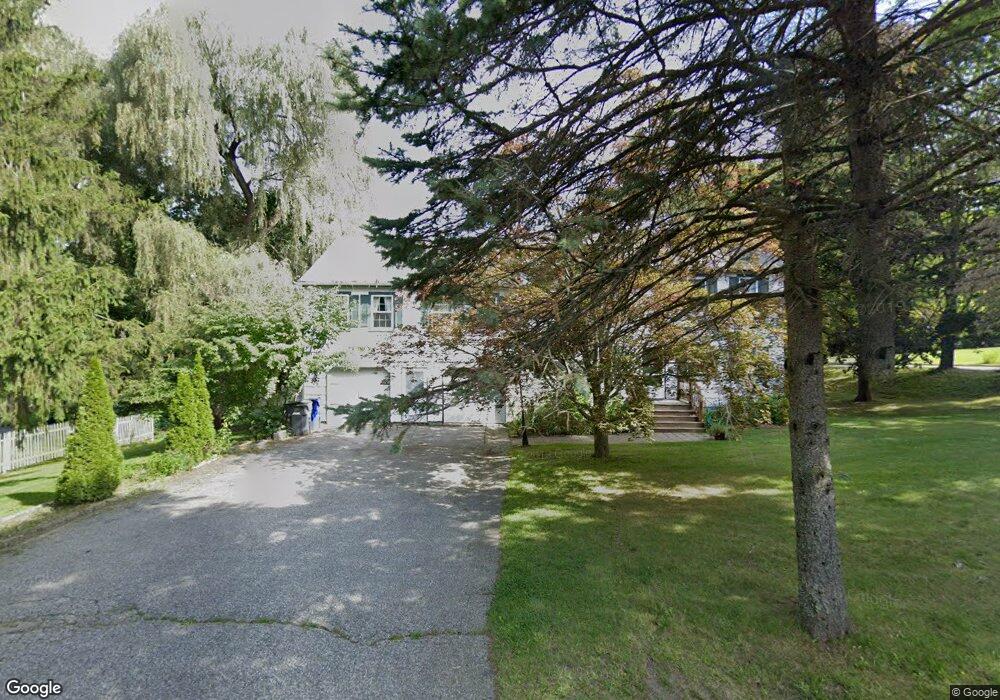
49 Hipp Rd New Milford, CT 06776
Estimated Value: $494,000 - $545,000
4
Beds
3
Baths
2,072
Sq Ft
$246/Sq Ft
Est. Value
About This Home
This home is located at 49 Hipp Rd, New Milford, CT 06776 and is currently estimated at $510,172, approximately $246 per square foot. 49 Hipp Rd is a home located in Litchfield County with nearby schools including Northville Elementary School, Sarah Noble Intermediate School, and Schaghticoke Middle School.
Ownership History
Date
Name
Owned For
Owner Type
Purchase Details
Closed on
Dec 22, 2016
Sold by
Guendelsberger Rebecca E and Waterman Rebecca E
Bought by
Waterman Bradford J and Waterman Laurie J
Current Estimated Value
Home Financials for this Owner
Home Financials are based on the most recent Mortgage that was taken out on this home.
Original Mortgage
$254,375
Outstanding Balance
$203,672
Interest Rate
3.25%
Mortgage Type
FHA
Estimated Equity
$306,500
Purchase Details
Closed on
Nov 12, 2008
Sold by
Fhlmc
Bought by
Guendelsberger Rebecca E and Waterman Brian G
Home Financials for this Owner
Home Financials are based on the most recent Mortgage that was taken out on this home.
Original Mortgage
$195,000
Interest Rate
6.13%
Purchase Details
Closed on
Nov 13, 2000
Sold by
Morrison Randall and Murphy Margaret
Bought by
Barney Peter and Barney Debra
Purchase Details
Closed on
May 11, 1995
Sold by
Berkley Fed Bk
Bought by
Morrison Randall L
Create a Home Valuation Report for This Property
The Home Valuation Report is an in-depth analysis detailing your home's value as well as a comparison with similar homes in the area
Home Values in the Area
Average Home Value in this Area
Purchase History
| Date | Buyer | Sale Price | Title Company |
|---|---|---|---|
| Waterman Bradford J | $294,000 | -- | |
| Guendelsberger Rebecca E | $195,000 | -- | |
| Barney Peter | $235,000 | -- | |
| Morrison Randall L | $150,000 | -- |
Source: Public Records
Mortgage History
| Date | Status | Borrower | Loan Amount |
|---|---|---|---|
| Open | Waterman Bradford J | $254,375 | |
| Previous Owner | Morrison Randall L | $252,000 | |
| Previous Owner | Morrison Randall L | $195,000 |
Source: Public Records
Tax History Compared to Growth
Tax History
| Year | Tax Paid | Tax Assessment Tax Assessment Total Assessment is a certain percentage of the fair market value that is determined by local assessors to be the total taxable value of land and additions on the property. | Land | Improvement |
|---|---|---|---|---|
| 2025 | $8,781 | $192,300 | $46,630 | $145,670 |
| 2024 | $5,725 | $192,300 | $46,630 | $145,670 |
| 2023 | $5,573 | $192,300 | $46,630 | $145,670 |
| 2022 | $5,452 | $192,300 | $46,630 | $145,670 |
| 2021 | $5,379 | $192,300 | $46,630 | $145,670 |
| 2020 | $5,440 | $189,680 | $51,150 | $138,530 |
| 2019 | $5,444 | $189,680 | $51,150 | $138,530 |
| 2018 | $5,343 | $189,680 | $51,150 | $138,530 |
| 2017 | $5,169 | $189,680 | $51,150 | $138,530 |
| 2016 | $5,078 | $189,680 | $51,150 | $138,530 |
| 2015 | $4,829 | $180,510 | $51,150 | $129,360 |
| 2014 | $4,747 | $180,510 | $51,150 | $129,360 |
Source: Public Records
Map
Nearby Homes
- 75 Buckingham Rd
- 31 Sterling Dr
- 5 Delivery Ln
- 4 High Trail
- 21 Crossmon Rd
- 85 Weathervane Dr
- 326 Litchfield Rd
- 151 Guernsey Ln
- 15 Harmony Trail
- 1 Blossom Ct Unit 1
- 10 Harmony Trail
- 22 Mountain View Terrace
- 12 Round Table Rd
- 3 Belair Dr Unit 3
- 18 Green Pond Rd
- 58 Chestnut Land Rd
- 40 Mount Tom Rd
- 62 Big Bear Hill Rd
- 116 Great Brook Rd
- 71 Upper Reservoir Rd