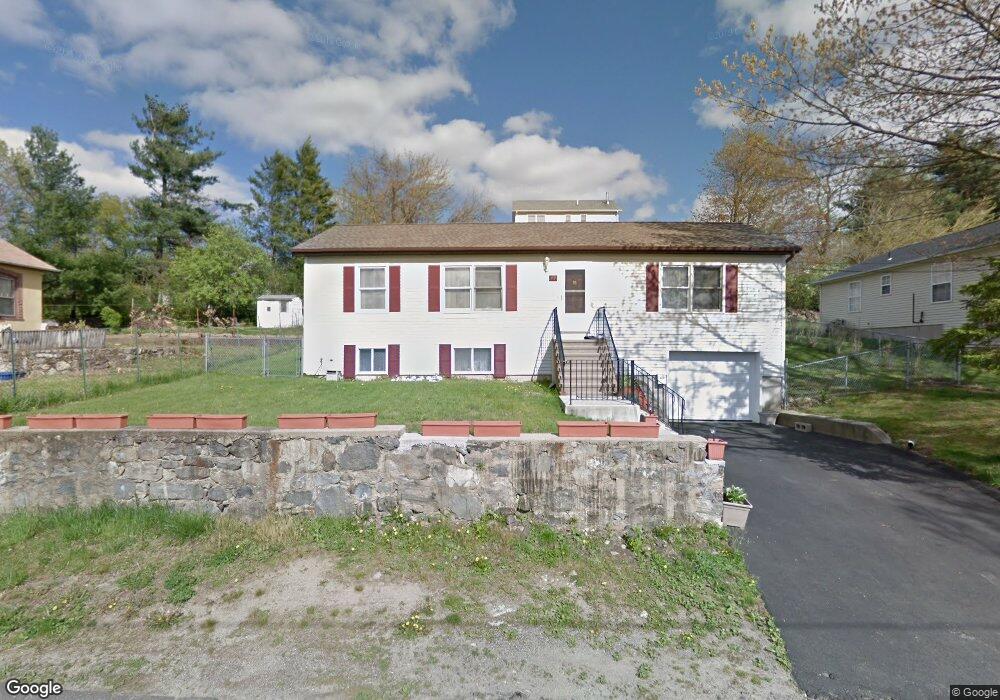
49 Hobart St Waterbury, CT 06704
North End District NeighborhoodEstimated Value: $250,000 - $312,000
3
Beds
3
Baths
1,152
Sq Ft
$248/Sq Ft
Est. Value
About This Home
This home is located at 49 Hobart St, Waterbury, CT 06704 and is currently estimated at $286,019, approximately $248 per square foot. 49 Hobart St is a home located in New Haven County with nearby schools including Woodrow Wilson School, Michael F. Wallace Middle School, and Crosby High School.
Ownership History
Date
Name
Owned For
Owner Type
Purchase Details
Closed on
Aug 4, 2010
Sold by
Holdim Prop Llc
Bought by
Medina Emily
Current Estimated Value
Purchase Details
Closed on
May 17, 2010
Sold by
Brass City Holdings Ll
Bought by
Holdim Prop Llc
Home Financials for this Owner
Home Financials are based on the most recent Mortgage that was taken out on this home.
Original Mortgage
$30,000
Interest Rate
5.11%
Mortgage Type
Purchase Money Mortgage
Purchase Details
Closed on
Mar 23, 2009
Sold by
Harvey Mercer Est and Harvey
Bought by
Deutsche Bank Natl T C
Purchase Details
Closed on
Jul 31, 1996
Sold by
Faubel Sherry
Bought by
Mercer Harvey and Harvey Carrie
Create a Home Valuation Report for This Property
The Home Valuation Report is an in-depth analysis detailing your home's value as well as a comparison with similar homes in the area
Home Values in the Area
Average Home Value in this Area
Purchase History
| Date | Buyer | Sale Price | Title Company |
|---|---|---|---|
| Medina Emily | $122,000 | -- | |
| Holdim Prop Llc | $57,500 | -- | |
| Brass City Homes Llc | $475,000 | -- | |
| Deutsche Bank Natl T C | -- | -- | |
| Mercer Harvey | $79,310 | -- |
Source: Public Records
Mortgage History
| Date | Status | Borrower | Loan Amount |
|---|---|---|---|
| Previous Owner | Mercer Harvey | $30,000 | |
| Previous Owner | Mercer Harvey | $74,625 | |
| Previous Owner | Mercer Harvey | $151,500 |
Source: Public Records
Tax History Compared to Growth
Tax History
| Year | Tax Paid | Tax Assessment Tax Assessment Total Assessment is a certain percentage of the fair market value that is determined by local assessors to be the total taxable value of land and additions on the property. | Land | Improvement |
|---|---|---|---|---|
| 2025 | $6,565 | $145,950 | $12,740 | $133,210 |
| 2024 | $7,216 | $145,950 | $12,740 | $133,210 |
| 2023 | $7,909 | $145,950 | $12,740 | $133,210 |
| 2022 | $4,849 | $80,530 | $12,760 | $67,770 |
| 2021 | $4,849 | $80,530 | $12,760 | $67,770 |
| 2020 | $4,849 | $80,530 | $12,760 | $67,770 |
| 2019 | $4,849 | $80,530 | $12,760 | $67,770 |
| 2018 | $4,849 | $80,530 | $12,760 | $67,770 |
| 2017 | $5,177 | $85,990 | $12,760 | $73,230 |
| 2016 | $5,177 | $85,990 | $12,760 | $73,230 |
| 2015 | $5,006 | $85,990 | $12,760 | $73,230 |
| 2014 | $5,006 | $85,990 | $12,760 | $73,230 |
Source: Public Records
Map
Nearby Homes