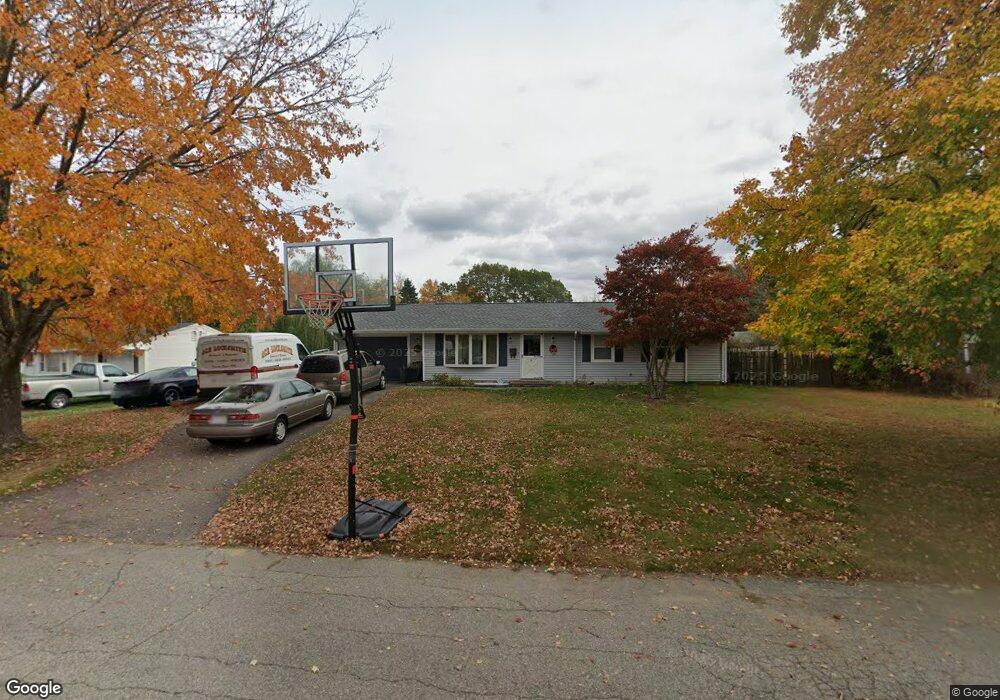
49 Hopkins Rd Brockton, MA 02302
Estimated Value: $511,000 - $574,000
4
Beds
1
Bath
1,758
Sq Ft
$303/Sq Ft
Est. Value
About This Home
This home is located at 49 Hopkins Rd, Brockton, MA 02302 and is currently estimated at $531,880, approximately $302 per square foot. 49 Hopkins Rd is a home located in Plymouth County with nearby schools including Davis K-8 School, John F. Kennedy Elementary School, and South Middle School.
Ownership History
Date
Name
Owned For
Owner Type
Purchase Details
Closed on
Jul 12, 2002
Sold by
Gowen Wade A and Gowen Lori A
Bought by
Page Mark V and Page Wendy J
Current Estimated Value
Purchase Details
Closed on
Jun 23, 1994
Sold by
Moran Michael J and Moran Renate
Bought by
Gowen Wade A and Gowen Lori A
Create a Home Valuation Report for This Property
The Home Valuation Report is an in-depth analysis detailing your home's value as well as a comparison with similar homes in the area
Home Values in the Area
Average Home Value in this Area
Purchase History
| Date | Buyer | Sale Price | Title Company |
|---|---|---|---|
| Page Mark V | $200,000 | -- | |
| Gowen Wade A | $88,000 | -- |
Source: Public Records
Mortgage History
| Date | Status | Borrower | Loan Amount |
|---|---|---|---|
| Open | Gowen Wade A | $200,600 | |
| Closed | Gowen Wade A | $15,000 | |
| Closed | Gowen Wade A | $205,000 |
Source: Public Records
Tax History Compared to Growth
Tax History
| Year | Tax Paid | Tax Assessment Tax Assessment Total Assessment is a certain percentage of the fair market value that is determined by local assessors to be the total taxable value of land and additions on the property. | Land | Improvement |
|---|---|---|---|---|
| 2025 | $5,178 | $427,600 | $160,500 | $267,100 |
| 2024 | $4,866 | $404,800 | $160,500 | $244,300 |
| 2023 | $4,695 | $361,700 | $110,800 | $250,900 |
| 2022 | $4,384 | $313,800 | $100,700 | $213,100 |
| 2021 | $4,217 | $290,800 | $93,600 | $197,200 |
| 2020 | $4,337 | $286,300 | $82,100 | $204,200 |
| 2019 | $4,070 | $261,900 | $78,400 | $183,500 |
| 2018 | $3,862 | $240,500 | $78,400 | $162,100 |
| 2017 | $3,647 | $226,500 | $78,400 | $148,100 |
| 2016 | $3,630 | $209,100 | $74,800 | $134,300 |
| 2015 | $3,496 | $192,600 | $74,800 | $117,800 |
| 2014 | $3,595 | $198,300 | $74,800 | $123,500 |
Source: Public Records
Map
Nearby Homes