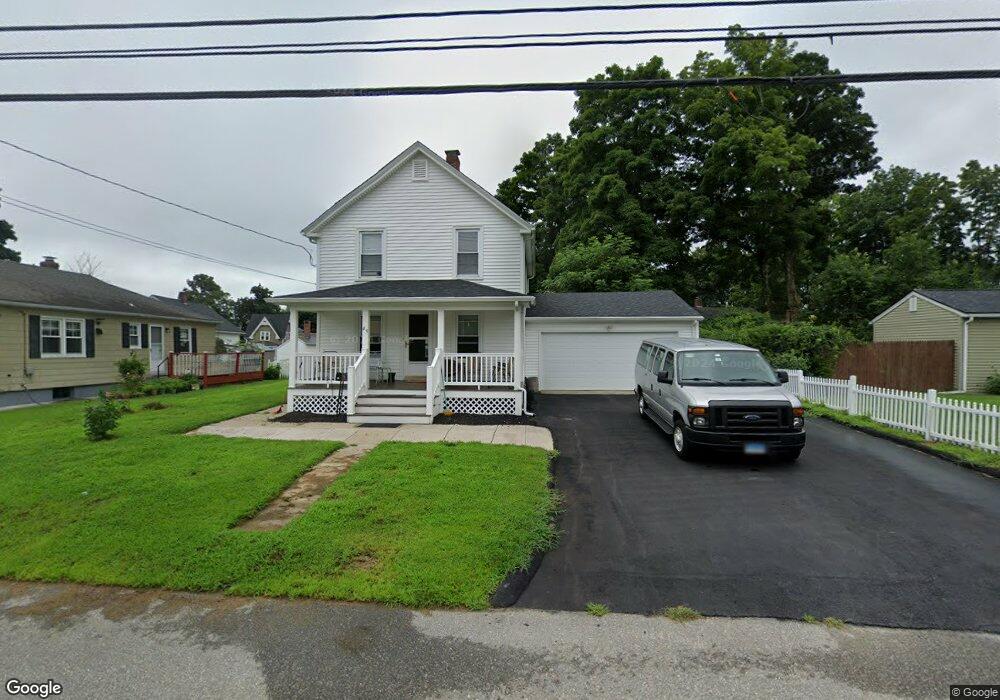
49 Hutchins St Danielson, CT 06239
Estimated Value: $250,323 - $296,000
3
Beds
2
Baths
1,253
Sq Ft
$221/Sq Ft
Est. Value
About This Home
This home is located at 49 Hutchins St, Danielson, CT 06239 and is currently estimated at $276,581, approximately $220 per square foot. 49 Hutchins St is a home located in Windham County with nearby schools including Killingly Central School, Killingly Memorial School, and Killingly Intermediate School.
Ownership History
Date
Name
Owned For
Owner Type
Purchase Details
Closed on
Oct 31, 2023
Sold by
Pereira George
Bought by
Pereira George and Aguiar Sharon A
Current Estimated Value
Purchase Details
Closed on
Mar 9, 2007
Sold by
Phonekeo Khamphone
Bought by
Pereira George
Home Financials for this Owner
Home Financials are based on the most recent Mortgage that was taken out on this home.
Original Mortgage
$174,000
Interest Rate
6.3%
Mortgage Type
Purchase Money Mortgage
Purchase Details
Closed on
Jan 25, 2001
Sold by
Department Of Housing & Urban Dev
Bought by
Phonekeo Khamphone
Purchase Details
Closed on
Jun 7, 1994
Sold by
Brooks Robert N and Brooks Inez
Bought by
Smith David C and Smith Nancy
Create a Home Valuation Report for This Property
The Home Valuation Report is an in-depth analysis detailing your home's value as well as a comparison with similar homes in the area
Home Values in the Area
Average Home Value in this Area
Purchase History
| Date | Buyer | Sale Price | Title Company |
|---|---|---|---|
| Pereira George | -- | None Available | |
| Pereira George | -- | None Available | |
| Pereira George | $174,000 | -- | |
| Pereira George | $174,000 | -- | |
| Phonekeo Khamphone | $67,000 | -- | |
| Phonekeo Khamphone | $67,000 | -- | |
| Smith David C | $82,500 | -- | |
| Smith David C | $82,500 | -- |
Source: Public Records
Mortgage History
| Date | Status | Borrower | Loan Amount |
|---|---|---|---|
| Previous Owner | Smith David C | $158,600 | |
| Previous Owner | Smith David C | $174,000 |
Source: Public Records
Tax History
| Year | Tax Paid | Tax Assessment Tax Assessment Total Assessment is a certain percentage of the fair market value that is determined by local assessors to be the total taxable value of land and additions on the property. | Land | Improvement |
|---|---|---|---|---|
| 2025 | $2,795 | $111,563 | $27,300 | $84,263 |
| 2024 | $2,668 | $111,563 | $27,300 | $84,263 |
| 2023 | $2,864 | $89,250 | $22,680 | $66,570 |
| 2022 | $2,694 | $89,250 | $22,680 | $66,570 |
| 2021 | $2,694 | $89,250 | $22,680 | $66,570 |
| 2020 | $2,650 | $89,250 | $22,680 | $66,570 |
| 2019 | $2,678 | $89,250 | $22,680 | $66,570 |
| 2017 | $2,184 | $67,690 | $14,420 | $53,270 |
| 2016 | $2,184 | $67,690 | $14,420 | $53,270 |
| 2015 | $2,140 | $67,690 | $14,420 | $53,270 |
| 2014 | $2,089 | $67,690 | $14,420 | $53,270 |
Source: Public Records
Map
Nearby Homes
- 10 Center St
- 24 Center St
- 73 Hawkins St
- 74 Athol St
- 102 Cottage St
- 144 Prospect Ave
- 48 Athol St Unit 48
- 133 Maple St
- 85 Furnace St
- 106 Water St
- 37 Katherine Ave
- 37 Ruth St
- 29 Rosedale St
- 135 Adelaide St
- 23 Tiffany St
- 18 Broad St
- 20 Wauregan Rd
- 35 S Main St
- 85 Mashentuck Rd
- 0 Providence Rd Unit 24080985
Your Personal Tour Guide
Ask me questions while you tour the home.