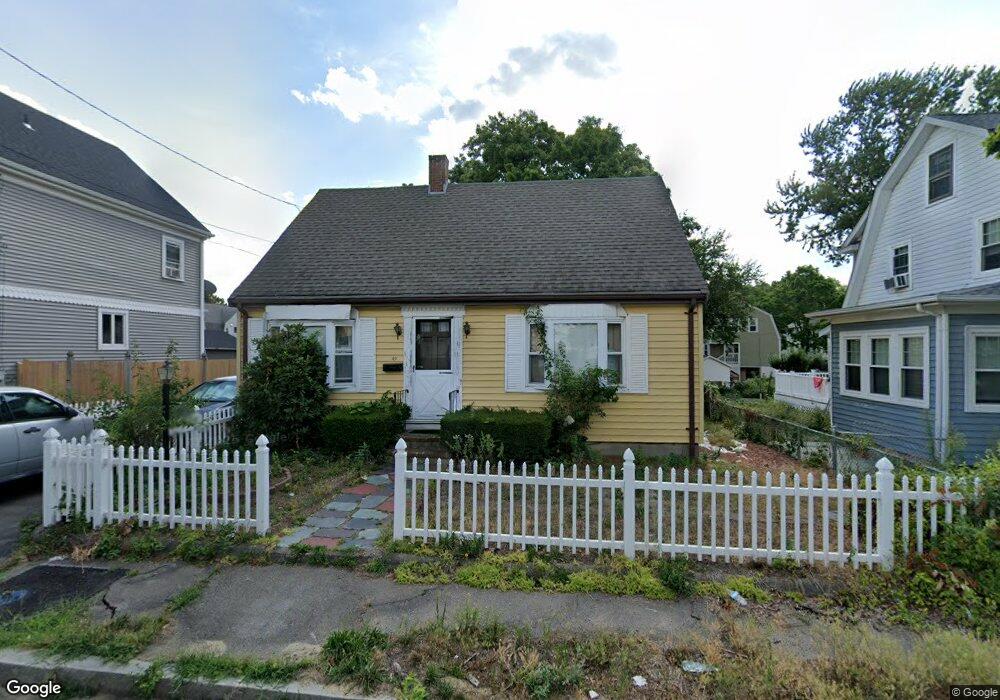
49 John St Quincy, MA 02171
Montclair NeighborhoodEstimated Value: $563,000 - $756,000
3
Beds
3
Baths
1,260
Sq Ft
$549/Sq Ft
Est. Value
About This Home
This home is located at 49 John St, Quincy, MA 02171 and is currently estimated at $691,548, approximately $548 per square foot. 49 John St is a home located in Norfolk County with nearby schools including Montclair Elementary School, Atlantic Middle School, and North Quincy High School.
Ownership History
Date
Name
Owned For
Owner Type
Purchase Details
Closed on
Jul 31, 2002
Sold by
Navarro Simon S and Navarro Elvira A
Bought by
Latommy
Current Estimated Value
Home Financials for this Owner
Home Financials are based on the most recent Mortgage that was taken out on this home.
Original Mortgage
$200,000
Outstanding Balance
$85,174
Interest Rate
6.64%
Mortgage Type
Purchase Money Mortgage
Estimated Equity
$606,374
Purchase Details
Closed on
May 8, 1992
Sold by
Broomhower Bernadette
Bought by
Navarro Simon S and Navarro Elvira A
Home Financials for this Owner
Home Financials are based on the most recent Mortgage that was taken out on this home.
Original Mortgage
$133,000
Interest Rate
8.91%
Mortgage Type
Purchase Money Mortgage
Create a Home Valuation Report for This Property
The Home Valuation Report is an in-depth analysis detailing your home's value as well as a comparison with similar homes in the area
Home Values in the Area
Average Home Value in this Area
Purchase History
| Date | Buyer | Sale Price | Title Company |
|---|---|---|---|
| Latommy | $310,000 | -- | |
| Navarro Simon S | $140,000 | -- |
Source: Public Records
Mortgage History
| Date | Status | Borrower | Loan Amount |
|---|---|---|---|
| Closed | Navarro Simon S | $100,000 | |
| Open | Latommy | $200,000 | |
| Previous Owner | Navarro Simon S | $130,000 | |
| Previous Owner | Navarro Simon S | $133,000 | |
| Previous Owner | Navarro Simon S | $78,000 |
Source: Public Records
Tax History
| Year | Tax Paid | Tax Assessment Tax Assessment Total Assessment is a certain percentage of the fair market value that is determined by local assessors to be the total taxable value of land and additions on the property. | Land | Improvement |
|---|---|---|---|---|
| 2025 | $7,548 | $654,600 | $369,300 | $285,300 |
| 2024 | $7,373 | $654,200 | $369,300 | $284,900 |
| 2023 | $6,881 | $618,200 | $351,800 | $266,400 |
| 2022 | $6,730 | $561,800 | $305,900 | $255,900 |
| 2021 | $6,388 | $526,200 | $291,300 | $234,900 |
| 2020 | $6,418 | $516,300 | $291,300 | $225,000 |
| 2019 | $5,910 | $470,900 | $272,200 | $198,700 |
| 2018 | $5,911 | $443,100 | $252,000 | $191,100 |
| 2017 | $5,709 | $402,900 | $240,100 | $162,800 |
| 2016 | $5,188 | $361,300 | $208,800 | $152,500 |
| 2015 | $4,904 | $335,900 | $189,800 | $146,100 |
| 2014 | $4,553 | $306,400 | $180,700 | $125,700 |
Source: Public Records
Map
Nearby Homes
- 115 W Squantum St Unit 517
- 115 W Squantum St Unit 203
- 115 W Squantum St Unit 811
- 100 W Squantum St Unit 411
- 54 Safford St
- 98 Safford St
- 17 Holmes St Unit 204
- 17 Holmes St Unit 2
- 17 Holmes St Unit 1
- 107 Fayette St
- 85 Myrtle St Unit 106
- 154 N Central Ave
- 70 Walnut St
- 85 E Squantum St Unit 10
- 150 Hancock St Unit 101
- 10 Weston Ave Unit 322
- 267-269 Farrington St
- 30 Elmwood Park
- 135 E Squantum St
- 20 Ellington Rd
Your Personal Tour Guide
Ask me questions while you tour the home.