
Seller's Agent in 2025
Maria Reed
Re/Max Vision
(508) 873-9254
1 in this area
27 Total Sales
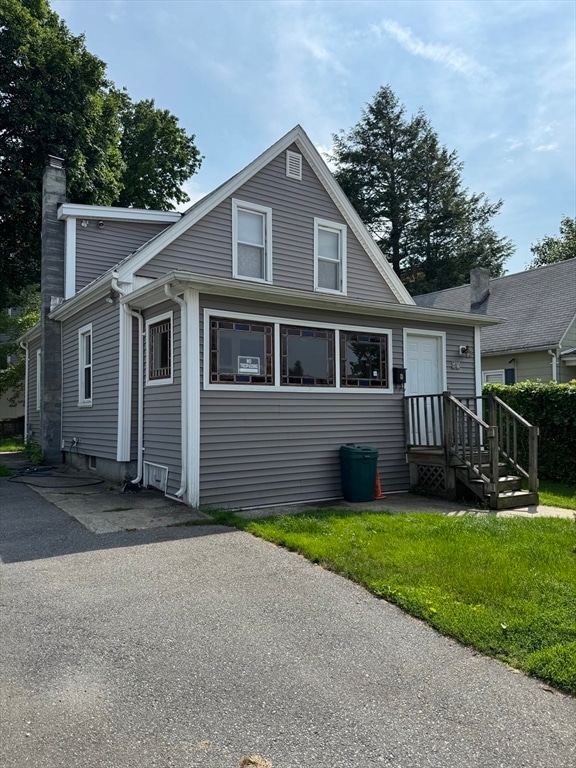
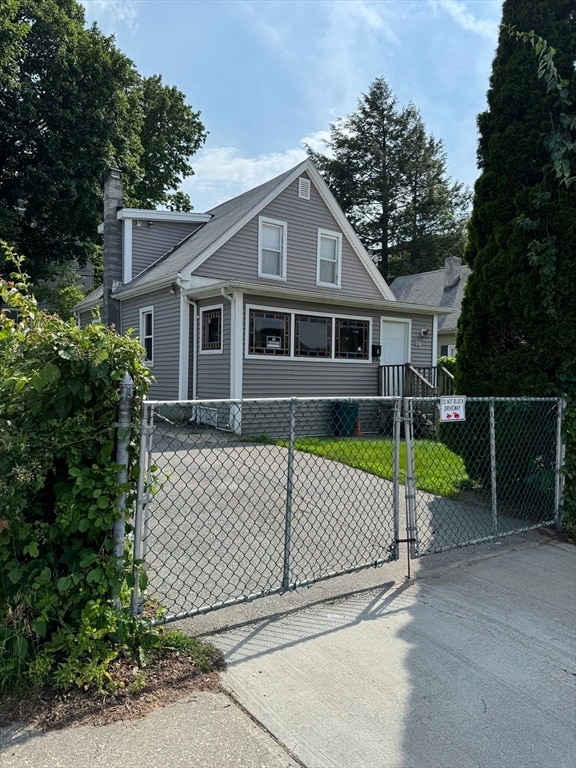
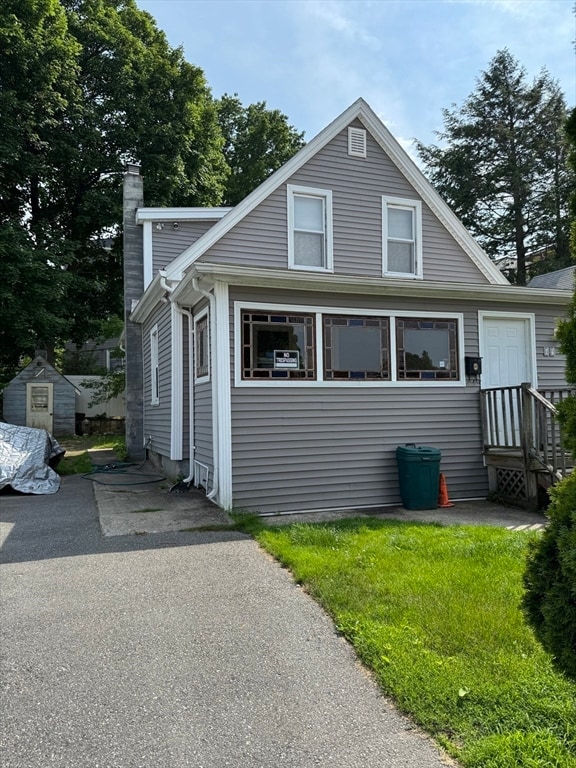
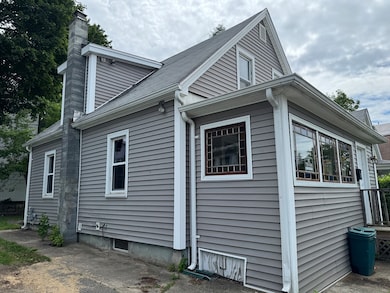
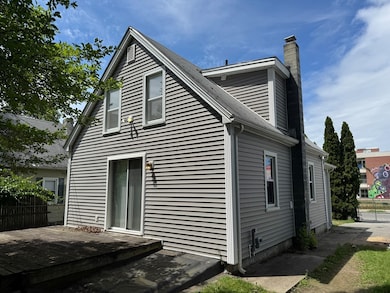
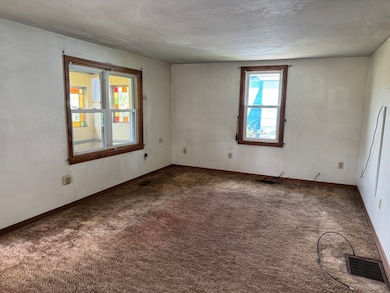
Nice 2 bedroom Cape that needs updating. Kitchen with darker oak cabinets open to dining room area...sliders lead to deck, back yard and shed. Carpeted livingroom with recessed lighting & vent pipe for future pellet stove. Natural gas heat. Tankless hot water wall unit. Hardwood stairs & same hardwood wall paneling leading to 2nd floor. Large primary front bedroom with smaller bedroom in the back. 1st floor laundry in closet in eat in dining area. Replacement windows. Original roof no leaks. Great as condo alternative. Convenient location close to highway access, downtown, schools & universities like WPI, hospitals UMass & St. Vincent's, Polar Park, shopping, restaurants, hotels, churches, theaters. Compact living great alternative to condo or renting an apartment with high monthly rental prices these days. Investors can rent out to students of nearby colleges & medical school. Move in condition, renovate it after owning, room by room.
| Date | Type | Sale Price | Title Company |
|---|---|---|---|
| Quit Claim Deed | $265,000 | -- | |
| Deed | $265,000 | -- | |
| Deed | $79,500 | -- | |
| Deed | $79,500 | -- |
| Date | Status | Loan Amount | Loan Type |
|---|---|---|---|
| Open | $251,750 | New Conventional | |
| Closed | $251,750 | New Conventional | |
| Previous Owner | $17,700 | No Value Available | |
| Previous Owner | $78,000 | No Value Available |
| Date | Event | Price | List to Sale | Price per Sq Ft |
|---|---|---|---|---|
| 08/12/2025 08/12/25 | Sold | $265,000 | -5.4% | $324 / Sq Ft |
| 07/09/2025 07/09/25 | Pending | -- | -- | -- |
| 06/30/2025 06/30/25 | For Sale | $280,000 | -- | $342 / Sq Ft |
| Year | Tax Paid | Tax Assessment Tax Assessment Total Assessment is a certain percentage of the fair market value that is determined by local assessors to be the total taxable value of land and additions on the property. | Land | Improvement |
|---|---|---|---|---|
| 2025 | $2,977 | $225,700 | $60,500 | $165,200 |
| 2024 | $2,838 | $206,400 | $60,500 | $145,900 |
| 2023 | $2,735 | $190,700 | $52,600 | $138,100 |
| 2022 | $2,528 | $166,200 | $42,100 | $124,100 |
| 2021 | $2,362 | $145,100 | $33,700 | $111,400 |
| 2020 | $2,239 | $131,700 | $33,400 | $98,300 |
| 2019 | $2,135 | $118,600 | $29,200 | $89,400 |
| 2018 | $2,127 | $112,500 | $29,200 | $83,300 |
| 2017 | $1,989 | $103,500 | $29,200 | $74,300 |
| 2016 | $1,999 | $97,000 | $22,000 | $75,000 |
| 2015 | $1,947 | $97,000 | $22,000 | $75,000 |
| 2014 | $1,895 | $97,000 | $22,000 | $75,000 |
Seller's Agent in 2025
Maria Reed
Re/Max Vision
(508) 873-9254
1 in this area
27 Total Sales
Seller Co-Listing Agent in 2025
Diane Luong
Re/Max Vision
(774) 239-2937
1 in this area
157 Total Sales
Buyer's Agent in 2025
Victoria Tran
The Nest Real Estate Agency, LLC
(508) 963-9818
1 in this area
34 Total Sales
Source: MLS Property Information Network (MLS PIN)
MLS Number: 73398290
APN: WORC-000002-000039-000008
Disclaimer: Certain information contained herein is derived from information provided by parties other than Homes.com. All information provided is deemed reliable, but is not guaranteed to be accurate and should be independently verified.
![]() The property listing data and information, or the Images, set forth herein were provided to MLS Property Information Network, Inc. from third party sources, including sellers, lessors and public records, and were compiled by MLS Property Information Network, Inc. The property listing data and information, and the Images, are for the personal, non-commercial use of consumers having a good faith interest in purchasing or leasing listed properties of the type displayed to them and may not be used for any purpose other than to identify prospective properties which such consumers may have a good faith interest in purchasing or leasing. MLS Property Information Network, Inc. and its subscribers disclaim any and all representations and warranties as to the accuracy of the property listing data and information, or as to the accuracy of any of the Images, set forth herein.
The property listing data and information, or the Images, set forth herein were provided to MLS Property Information Network, Inc. from third party sources, including sellers, lessors and public records, and were compiled by MLS Property Information Network, Inc. The property listing data and information, and the Images, are for the personal, non-commercial use of consumers having a good faith interest in purchasing or leasing listed properties of the type displayed to them and may not be used for any purpose other than to identify prospective properties which such consumers may have a good faith interest in purchasing or leasing. MLS Property Information Network, Inc. and its subscribers disclaim any and all representations and warranties as to the accuracy of the property listing data and information, or as to the accuracy of any of the Images, set forth herein.
Ask me questions while you tour the home.