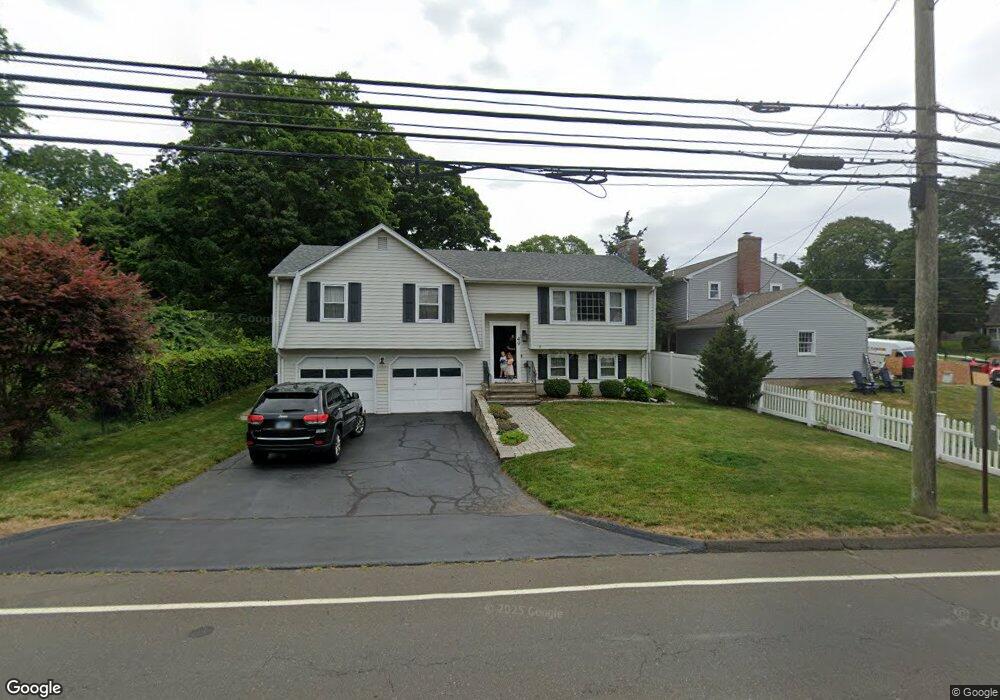
49 Kirkham St Branford, CT 06405
Estimated Value: $404,000 - $467,000
3
Beds
2
Baths
1,184
Sq Ft
$376/Sq Ft
Est. Value
About This Home
This home is located at 49 Kirkham St, Branford, CT 06405 and is currently estimated at $444,598, approximately $375 per square foot. 49 Kirkham St is a home located in New Haven County with nearby schools including Francis Walsh Intermediate School, Branford High School, and East Shoreline Catholic Academy.
Ownership History
Date
Name
Owned For
Owner Type
Purchase Details
Closed on
Feb 17, 2010
Sold by
Zdunek Frank and Zdunek Irene
Bought by
Zdunek Mark
Current Estimated Value
Purchase Details
Closed on
Jul 7, 1987
Sold by
Wall Kenneth F
Bought by
Zdunek Frank
Home Financials for this Owner
Home Financials are based on the most recent Mortgage that was taken out on this home.
Original Mortgage
$50,000
Interest Rate
10.76%
Create a Home Valuation Report for This Property
The Home Valuation Report is an in-depth analysis detailing your home's value as well as a comparison with similar homes in the area
Home Values in the Area
Average Home Value in this Area
Purchase History
| Date | Buyer | Sale Price | Title Company |
|---|---|---|---|
| Zdunek Mark | -- | -- | |
| Zdunek Frank | $190,000 | -- |
Source: Public Records
Mortgage History
| Date | Status | Borrower | Loan Amount |
|---|---|---|---|
| Previous Owner | Zdunek Frank | $50,000 | |
| Previous Owner | Zdunek Frank | $50,000 |
Source: Public Records
Tax History
| Year | Tax Paid | Tax Assessment Tax Assessment Total Assessment is a certain percentage of the fair market value that is determined by local assessors to be the total taxable value of land and additions on the property. | Land | Improvement |
|---|---|---|---|---|
| 2025 | $6,013 | $281,000 | $73,500 | $207,500 |
| 2024 | $5,081 | $166,700 | $61,900 | $104,800 |
| 2023 | $4,983 | $166,700 | $61,900 | $104,800 |
| 2022 | $4,909 | $166,700 | $61,900 | $104,800 |
| 2021 | $4,909 | $166,700 | $61,900 | $104,800 |
| 2020 | $4,821 | $166,700 | $61,900 | $104,800 |
| 2019 | $4,887 | $168,100 | $61,900 | $106,200 |
| 2018 | $4,814 | $168,100 | $61,900 | $106,200 |
| 2017 | $4,786 | $168,100 | $61,900 | $106,200 |
| 2016 | $4,608 | $168,100 | $61,900 | $106,200 |
| 2015 | $4,527 | $168,100 | $61,900 | $106,200 |
| 2014 | $4,516 | $172,100 | $61,900 | $110,200 |
Source: Public Records
Map
Nearby Homes
- 10 Hammer Place
- 60 Maple St Unit 17
- 60 Maple St Unit 31
- 61-63 Home Place
- 59 Home Place
- 81 Main St Unit 15B
- 49 Rose St Unit 204
- 26 N Main St Unit TRLR 25
- 53 Montowese St
- 22 Montoya Dr Unit 2
- 74 Quarry Dock Rd
- 48 Montoya Dr Unit 48
- 16 Pine Orchard Rd Unit 27
- 10 Hamre Ln Unit C
- 7 Hamre Ln Unit A
- 66 Montoya Dr Unit 66
- 320 Maple St
- 85 Cherry Hill Rd
- 50 Short Beach Rd
- 49 Stannard Ave
Your Personal Tour Guide
Ask me questions while you tour the home.