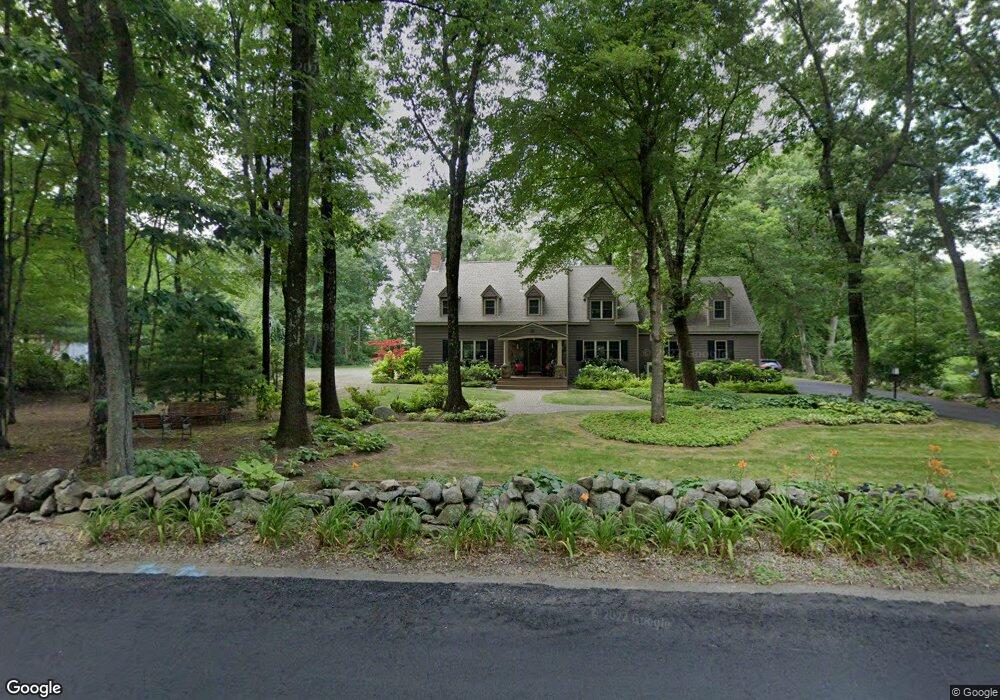
49 Lackey St Westborough, MA 01581
Estimated Value: $863,788 - $1,060,000
3
Beds
3
Baths
2,477
Sq Ft
$378/Sq Ft
Est. Value
About This Home
This home is located at 49 Lackey St, Westborough, MA 01581 and is currently estimated at $935,947, approximately $377 per square foot. 49 Lackey St is a home located in Worcester County with nearby schools including Westborough High School.
Ownership History
Date
Name
Owned For
Owner Type
Purchase Details
Closed on
Apr 2, 2008
Sold by
Thomas J Kelly and Nicholson Judith
Bought by
Thomas Tr J Kelly and Nicholson Judith A
Current Estimated Value
Purchase Details
Closed on
Apr 20, 1989
Sold by
Bussone Ellen
Bought by
Thomas Kelly
Create a Home Valuation Report for This Property
The Home Valuation Report is an in-depth analysis detailing your home's value as well as a comparison with similar homes in the area
Home Values in the Area
Average Home Value in this Area
Purchase History
| Date | Buyer | Sale Price | Title Company |
|---|---|---|---|
| Thomas Tr J Kelly | -- | -- | |
| Thomas Kelly | $250,000 | -- | |
| Thomas Kelly | $250,000 | -- |
Source: Public Records
Mortgage History
| Date | Status | Borrower | Loan Amount |
|---|---|---|---|
| Open | Thomas Kelly | $395,000 | |
| Previous Owner | Thomas Kelly | $227,250 | |
| Previous Owner | Thomas Kelly | $200,000 |
Source: Public Records
Tax History Compared to Growth
Tax History
| Year | Tax Paid | Tax Assessment Tax Assessment Total Assessment is a certain percentage of the fair market value that is determined by local assessors to be the total taxable value of land and additions on the property. | Land | Improvement |
|---|---|---|---|---|
| 2025 | $11,559 | $709,600 | $343,500 | $366,100 |
| 2024 | $10,279 | $626,400 | $326,700 | $299,700 |
| 2023 | $9,831 | $583,800 | $308,200 | $275,600 |
| 2022 | $9,373 | $506,900 | $252,500 | $254,400 |
| 2021 | $8,936 | $482,000 | $227,600 | $254,400 |
| 2020 | $8,753 | $477,800 | $223,400 | $254,400 |
| 2019 | $8,485 | $462,900 | $221,400 | $241,500 |
| 2018 | $2,867 | $431,600 | $213,100 | $218,500 |
| 2017 | $7,682 | $431,600 | $213,100 | $218,500 |
| 2016 | $7,346 | $413,400 | $206,900 | $206,500 |
| 2015 | $7,034 | $378,400 | $194,500 | $183,900 |
Source: Public Records
Map
Nearby Homes