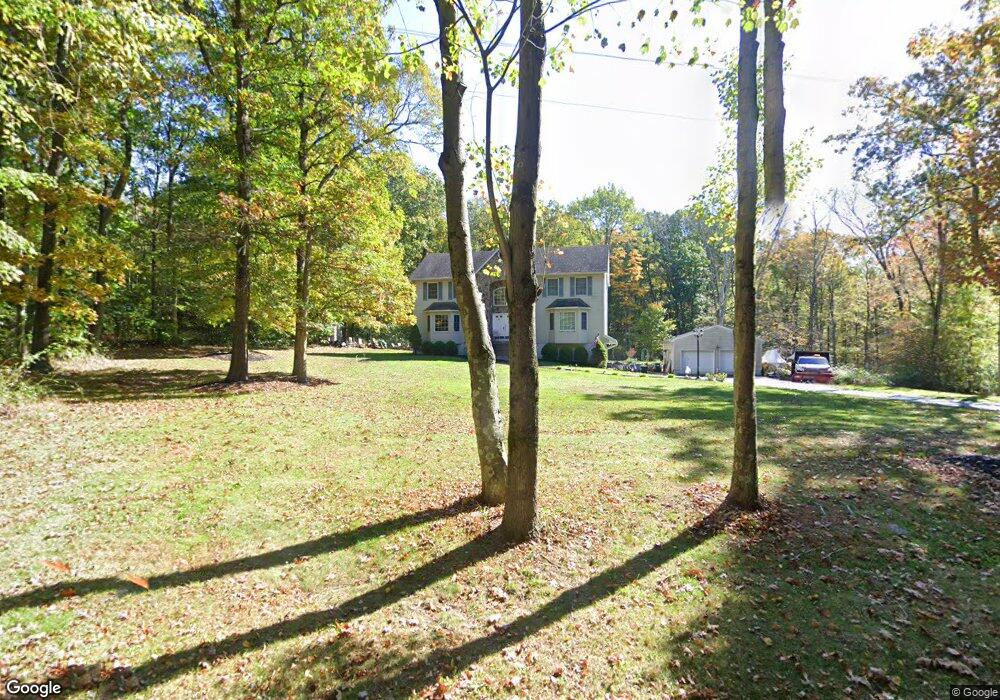
49 Lake Denmark Rd Rockaway, NJ 07866
Estimated Value: $798,000 - $876,894
--
Bed
--
Bath
2,606
Sq Ft
$321/Sq Ft
Est. Value
About This Home
This home is located at 49 Lake Denmark Rd, Rockaway, NJ 07866 and is currently estimated at $835,474, approximately $320 per square foot. 49 Lake Denmark Rd is a home located in Morris County with nearby schools including Katherine D. Malone School and Copeland Middle School.
Ownership History
Date
Name
Owned For
Owner Type
Purchase Details
Closed on
Feb 9, 2024
Sold by
Luele Denise Annette
Bought by
Denise Annette Luele Trust and Luele
Current Estimated Value
Purchase Details
Closed on
May 13, 2015
Sold by
Shah Jignesh U and Shah Denise A
Bought by
Shah Denise A and Martin Antoinette
Purchase Details
Closed on
Nov 26, 1997
Sold by
Annex Construction Inc
Bought by
Annex Builders Llc
Home Financials for this Owner
Home Financials are based on the most recent Mortgage that was taken out on this home.
Original Mortgage
$95,000
Interest Rate
7.28%
Purchase Details
Closed on
Nov 25, 1997
Sold by
Annex Builders Llc
Bought by
Shah Jignese U and Shah Denise A
Home Financials for this Owner
Home Financials are based on the most recent Mortgage that was taken out on this home.
Original Mortgage
$95,000
Interest Rate
7.28%
Create a Home Valuation Report for This Property
The Home Valuation Report is an in-depth analysis detailing your home's value as well as a comparison with similar homes in the area
Home Values in the Area
Average Home Value in this Area
Purchase History
| Date | Buyer | Sale Price | Title Company |
|---|---|---|---|
| Denise Annette Luele Trust | -- | None Listed On Document | |
| Denise Annette Luele Trust | -- | None Listed On Document | |
| Shah Denise A | -- | Attorney | |
| Annex Builders Llc | -- | -- | |
| Shah Jignese U | $260,000 | -- |
Source: Public Records
Mortgage History
| Date | Status | Borrower | Loan Amount |
|---|---|---|---|
| Previous Owner | Shah Jignese U | $95,000 |
Source: Public Records
Tax History Compared to Growth
Tax History
| Year | Tax Paid | Tax Assessment Tax Assessment Total Assessment is a certain percentage of the fair market value that is determined by local assessors to be the total taxable value of land and additions on the property. | Land | Improvement |
|---|---|---|---|---|
| 2025 | $16,763 | $704,300 | $217,900 | $486,400 |
| 2024 | $16,051 | $653,800 | $194,300 | $459,500 |
| 2023 | $16,051 | $611,700 | $176,900 | $434,800 |
| 2022 | $15,362 | $578,300 | $163,600 | $414,700 |
| 2021 | $15,362 | $541,300 | $144,600 | $396,700 |
| 2020 | $15,057 | $530,000 | $142,200 | $387,800 |
| 2019 | $14,793 | $518,500 | $137,500 | $381,000 |
| 2018 | $14,579 | $502,900 | $137,600 | $365,300 |
| 2017 | $15,089 | $483,300 | $147,100 | $336,200 |
| 2016 | $16,914 | $548,800 | $147,100 | $401,700 |
| 2015 | $16,793 | $548,800 | $147,100 | $401,700 |
| 2014 | $16,480 | $548,800 | $147,100 | $401,700 |
Source: Public Records
Map
Nearby Homes
- 50 Lake Denmark Rd
- 11 Darlington Dr
- 889 Green Pond Rd
- 30 N Cape Trail
- 9 Lindberg Trail
- 9 Balchen Way
- 157 Lake End Rd
- 20 Forest Ridge Terrace
- 75D Upper Hibernia Rd
- 37 Garnet Dr
- 338 Green Pond Rd
- 1 Main Rd
- 6 Redmans Dr
- 826 Green Pond Rd
- 1 Pioneer Trail
- 9 Lavina Trail
- 4 Village Place
- 5327 Berkshire Valley Rd Unit 5
- 7 Dover Milton Rd
- 13 Paderewski Rd
- 32 Denmark-Marcella
- 47 Lake Denmark Rd
- 54 Lake Denmark Rd
- 39 Lake Denmark Rd
- 44 Lake Denmark Rd
- 40 Lake Denmark Rd
- 35 Lake Denmark Rd
- 8 Rolling Ridge Dr
- 6 Rolling Ridge Dr
- 36 Lake Denmark Rd
- 4 Rolling Ridge Dr
- 10 Rolling Ridge Dr
- 59 Lake Denmark Rd
- 12 Rolling Ridge Dr
- 3 Rolling Ridge Dr
- 32 Lake Denmark Rd
- 2 Rolling Ridge Dr
- 5 Rolling Ridge Dr
- 14 Rolling Ridge Dr
- 7 Rolling Ridge Dr