49 Main St Oxford, MA 01540
Estimated Value: $487,000 - $494,000
3
Beds
2
Baths
1,960
Sq Ft
$250/Sq Ft
Est. Value
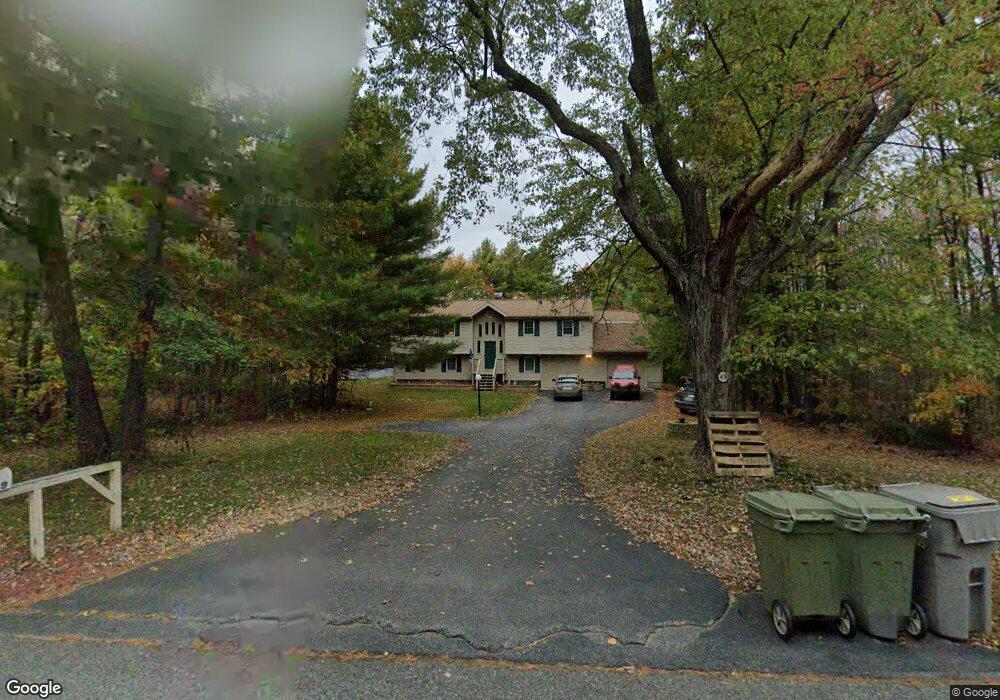
About This Home
This home is located at 49 Main St, Oxford, MA 01540 and is currently estimated at $490,730, approximately $250 per square foot. 49 Main St is a home located in Worcester County with nearby schools including Alfred M Chaffee, Oxford High School, and Clara Barton Elementary School.
Ownership History
Date
Name
Owned For
Owner Type
Purchase Details
Closed on
Sep 2, 2008
Sold by
Williams Elizabeth D and Williams John B
Bought by
Plasse Daniel J and Boucher Susan
Current Estimated Value
Home Financials for this Owner
Home Financials are based on the most recent Mortgage that was taken out on this home.
Original Mortgage
$180,800
Outstanding Balance
$118,925
Interest Rate
6.29%
Mortgage Type
Purchase Money Mortgage
Estimated Equity
$371,805
Create a Home Valuation Report for This Property
The Home Valuation Report is an in-depth analysis detailing your home's value as well as a comparison with similar homes in the area
Home Values in the Area
Average Home Value in this Area
Purchase History
| Date | Buyer | Sale Price | Title Company |
|---|---|---|---|
| Plasse Daniel J | $226,000 | -- |
Source: Public Records
Mortgage History
| Date | Status | Borrower | Loan Amount |
|---|---|---|---|
| Open | Plasse Daniel J | $180,800 |
Source: Public Records
Tax History
| Year | Tax Paid | Tax Assessment Tax Assessment Total Assessment is a certain percentage of the fair market value that is determined by local assessors to be the total taxable value of land and additions on the property. | Land | Improvement |
|---|---|---|---|---|
| 2025 | $54 | $429,400 | $122,300 | $307,100 |
| 2024 | $5,184 | $384,600 | $113,100 | $271,500 |
| 2023 | $5,081 | $372,500 | $101,000 | $271,500 |
| 2022 | $4,263 | $263,800 | $69,100 | $194,700 |
| 2021 | $4,147 | $250,900 | $65,700 | $185,200 |
| 2020 | $3,978 | $238,800 | $65,700 | $173,100 |
| 2019 | $3,478 | $204,200 | $65,700 | $138,500 |
| 2018 | $3,328 | $192,700 | $65,700 | $127,000 |
| 2017 | $3,326 | $197,400 | $65,700 | $131,700 |
| 2016 | $3,342 | $197,400 | $65,700 | $131,700 |
| 2015 | $3,117 | $197,400 | $65,700 | $131,700 |
| 2014 | $3,050 | $203,300 | $65,700 | $137,600 |
Source: Public Records
Map
Nearby Homes
Your Personal Tour Guide
Ask me questions while you tour the home.