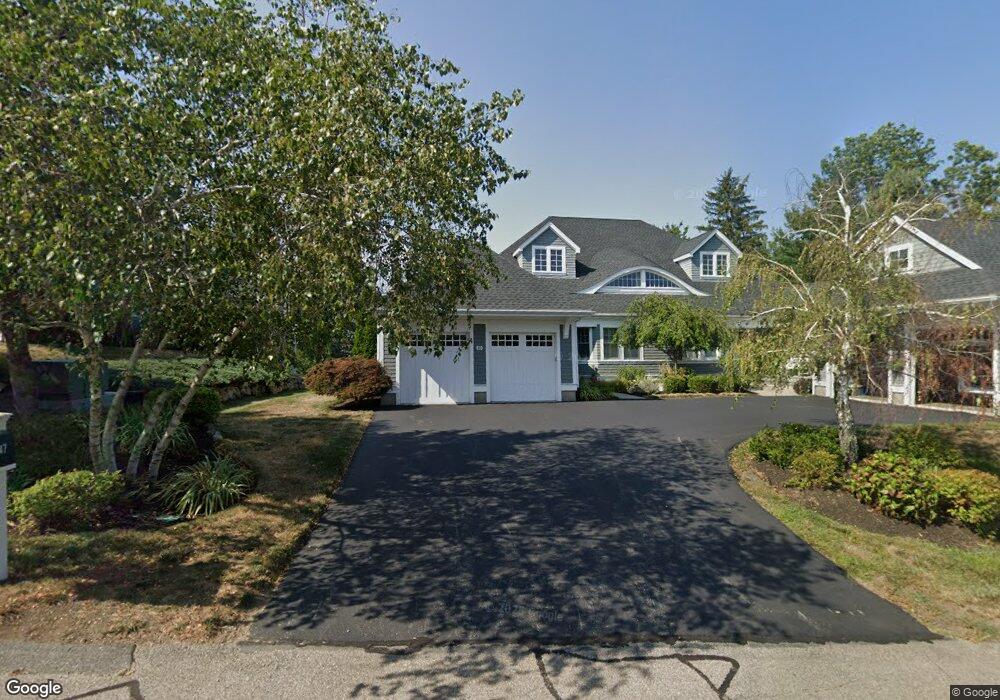
49 Maplecroft Ln Ipswich, MA 01938
Estimated Value: $1,650,227 - $1,902,000
3
Beds
4
Baths
3,375
Sq Ft
$521/Sq Ft
Est. Value
About This Home
This home is located at 49 Maplecroft Ln, Ipswich, MA 01938 and is currently estimated at $1,759,076, approximately $521 per square foot. 49 Maplecroft Ln is a home located in Essex County with nearby schools including Ipswich High School and Pingree School.
Ownership History
Date
Name
Owned For
Owner Type
Purchase Details
Closed on
Jun 27, 2024
Sold by
Harlow F Labarge Ret 2022 and Labarge
Bought by
Labarge Harlow F
Current Estimated Value
Home Financials for this Owner
Home Financials are based on the most recent Mortgage that was taken out on this home.
Original Mortgage
$52,500
Outstanding Balance
$50,597
Interest Rate
7.02%
Mortgage Type
Second Mortgage Made To Cover Down Payment
Estimated Equity
$1,708,479
Purchase Details
Closed on
May 18, 2022
Sold by
Labarge Harlow
Bought by
H F Labarge Ret 2022 and Labarge
Purchase Details
Closed on
Dec 4, 2009
Sold by
Hallahan Peter M and Hallahan Diane D
Bought by
Labarge Harlow
Home Financials for this Owner
Home Financials are based on the most recent Mortgage that was taken out on this home.
Original Mortgage
$680,000
Interest Rate
5.01%
Mortgage Type
Purchase Money Mortgage
Create a Home Valuation Report for This Property
The Home Valuation Report is an in-depth analysis detailing your home's value as well as a comparison with similar homes in the area
Home Values in the Area
Average Home Value in this Area
Purchase History
| Date | Buyer | Sale Price | Title Company |
|---|---|---|---|
| Labarge Harlow F | -- | None Available | |
| Labarge Harlow F | -- | None Available | |
| Labarge Harlow F | -- | None Available | |
| H F Labarge Ret 2022 | -- | None Available | |
| H F Labarge Ret 2022 | -- | None Available | |
| H F Labarge Ret 2022 | -- | None Available | |
| Labarge Harlow | $850,000 | -- | |
| Labarge Harlow | $850,000 | -- |
Source: Public Records
Mortgage History
| Date | Status | Borrower | Loan Amount |
|---|---|---|---|
| Open | Labarge Harlow F | $52,500 | |
| Closed | Labarge Harlow F | $52,500 | |
| Previous Owner | Labarge Harlow | $652,000 | |
| Previous Owner | Labarge Harlow | $678,500 | |
| Previous Owner | Labarge Harlow | $680,000 |
Source: Public Records
Tax History
| Year | Tax Paid | Tax Assessment Tax Assessment Total Assessment is a certain percentage of the fair market value that is determined by local assessors to be the total taxable value of land and additions on the property. | Land | Improvement |
|---|---|---|---|---|
| 2025 | $16,871 | $1,513,100 | $0 | $1,513,100 |
| 2024 | $16,021 | $1,407,800 | $0 | $1,407,800 |
| 2023 | $13,981 | $1,143,200 | $0 | $1,143,200 |
| 2022 | $10,836 | $842,600 | $0 | $842,600 |
| 2021 | $11,234 | $849,800 | $0 | $849,800 |
| 2020 | $11,265 | $803,500 | $0 | $803,500 |
| 2019 | $11,321 | $803,500 | $0 | $803,500 |
| 2018 | $11,193 | $786,000 | $0 | $786,000 |
| 2017 | $11,129 | $784,300 | $0 | $784,300 |
| 2016 | $11,388 | $766,900 | $0 | $766,900 |
| 2015 | $9,989 | $739,400 | $0 | $739,400 |
Source: Public Records
Map
Nearby Homes
- 9 Booth Ct Unit 9
- 9 Booth Ct
- 38 Buttonwood
- 38 Buttonwood Unit 30
- 30 Buttonwood
- 125 Topsfield Rd
- 92 Pineswamp Rd
- 133 Topsfield Rd
- 45 Pineswamp Rd
- 37 East St
- 4 Ruby Cir
- 196 Country Club Way
- 24 Primrose Ln Unit 24
- 10 Fairway Dr Unit 10
- 16 Fairway Dr Unit 16
- 6 James Rd
- 10 Choate Ln
- 7 Hickory Ln
- 500 Colonial Dr Unit 5
- 9 Ryan Ave
- 47 Maplecroft Ln
- 47 Maplecroft Ln Unit 1
- 47 Maplecroft Ln Unit 47
- 51 Maplecroft Ln
- 51 Maplecroft Ln Unit 1
- 53 Maplecroft Ln
- 4 Haddington Field
- 12 Moray Ln
- 10 Moray Ln Unit 10
- 10 Moray Ln
- 2 Moray Ln
- 12 Moray Ln Unit 12
- 12 Moray Ln Unit 6
- 8 Moray Ln Unit 8
- 55 Maplecroft Ln
- 4 Buttonwood Ln Unit 4
- 2 Haddington Field Unit V2
- 2 Haddington Field Unit 2
- 6 Buttonwood Ln Unit 6
- 18 Moray Ln Unit 18
Your Personal Tour Guide
Ask me questions while you tour the home.