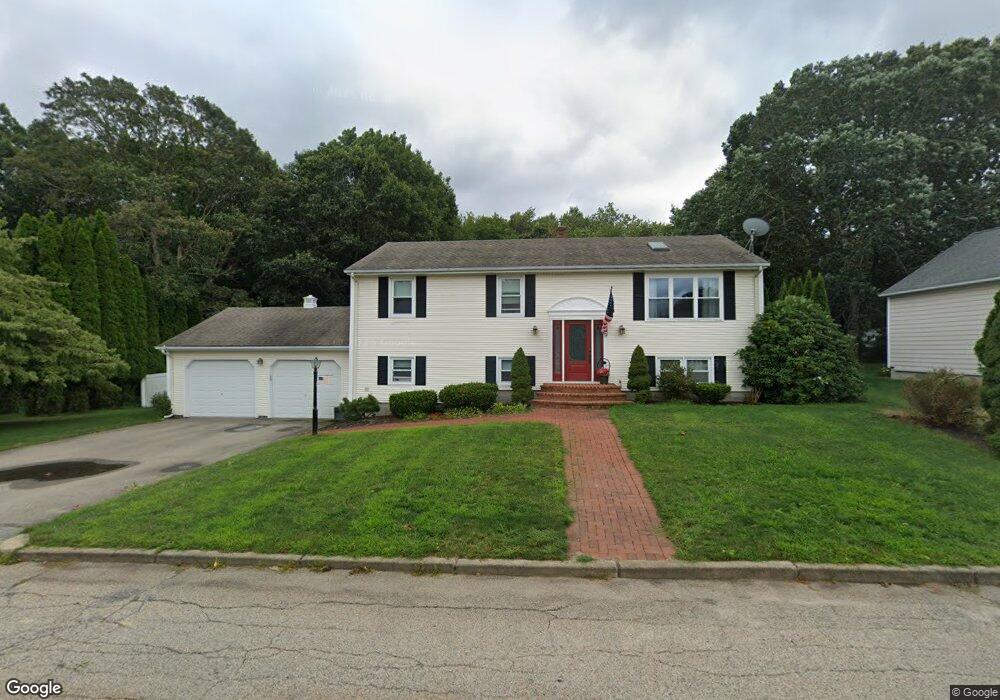
49 Marco Dr West Warwick, RI 02893
Crompton NeighborhoodEstimated Value: $473,000 - $513,000
4
Beds
2
Baths
2,044
Sq Ft
$238/Sq Ft
Est. Value
About This Home
This home is located at 49 Marco Dr, West Warwick, RI 02893 and is currently estimated at $486,797, approximately $238 per square foot. 49 Marco Dr is a home located in Kent County with nearby schools including West Warwick High School.
Ownership History
Date
Name
Owned For
Owner Type
Purchase Details
Closed on
Jan 10, 2024
Sold by
Arruda Gregg J and Tondra Michael
Bought by
Tondra Michael
Current Estimated Value
Purchase Details
Closed on
Nov 21, 1997
Sold by
Deresta Joseph A and Deresta Susan
Bought by
Arruda Gregg J and Tondra Michael
Create a Home Valuation Report for This Property
The Home Valuation Report is an in-depth analysis detailing your home's value as well as a comparison with similar homes in the area
Home Values in the Area
Average Home Value in this Area
Purchase History
| Date | Buyer | Sale Price | Title Company |
|---|---|---|---|
| Tondra Michael | -- | None Available | |
| Arruda Gregg J | $131,000 | -- |
Source: Public Records
Mortgage History
| Date | Status | Borrower | Loan Amount |
|---|---|---|---|
| Previous Owner | Arruda Gregg J | $54,640 | |
| Previous Owner | Arruda Gregg J | $160,000 | |
| Previous Owner | Arruda Gregg J | $90,605 | |
| Previous Owner | Arruda Gregg J | $80,000 |
Source: Public Records
Tax History Compared to Growth
Tax History
| Year | Tax Paid | Tax Assessment Tax Assessment Total Assessment is a certain percentage of the fair market value that is determined by local assessors to be the total taxable value of land and additions on the property. | Land | Improvement |
|---|---|---|---|---|
| 2025 | $6,205 | $434,200 | $119,100 | $315,100 |
| 2024 | $6,364 | $340,500 | $94,100 | $246,400 |
| 2023 | $6,238 | $340,500 | $94,100 | $246,400 |
| 2022 | $6,143 | $340,500 | $94,100 | $246,400 |
| 2021 | $6,334 | $275,400 | $75,300 | $200,100 |
| 2020 | $6,334 | $275,400 | $75,300 | $200,100 |
| 2019 | $8,075 | $275,400 | $75,300 | $200,100 |
| 2018 | $5,822 | $214,200 | $73,100 | $141,100 |
| 2017 | $5,636 | $214,200 | $73,100 | $141,100 |
| 2016 | $5,535 | $214,200 | $73,100 | $141,100 |
| 2015 | $5,343 | $205,800 | $69,200 | $136,600 |
| 2014 | $5,225 | $205,800 | $69,200 | $136,600 |
Source: Public Records
Map
Nearby Homes
- 565 Quaker Ln Unit 58
- 565 Quaker Ln Unit 124
- 650 E Greenwich Ave Unit 6-101
- 76 Sycamore Dr
- 500 E Greenwich Ave Unit 116
- 500 E Greenwich Ave Unit 101
- 750 Quaker Ln Unit B101
- 125 Setian Ln
- 34 Silverwood Ln
- 33 Judy Terrace
- 177 Cowesett Ave
- 18 Jacques St
- 170 Cowesett Ave
- 25 Fawn Ln
- 0 James P Murphy Ind Hwy
- 15 Eagle Run Unit C
- 25 Deer Run Crossing Unit 45
- 6 Teresa Ann Crossing
- 40 E Greenwich Ave
- 34 Buckley Ave