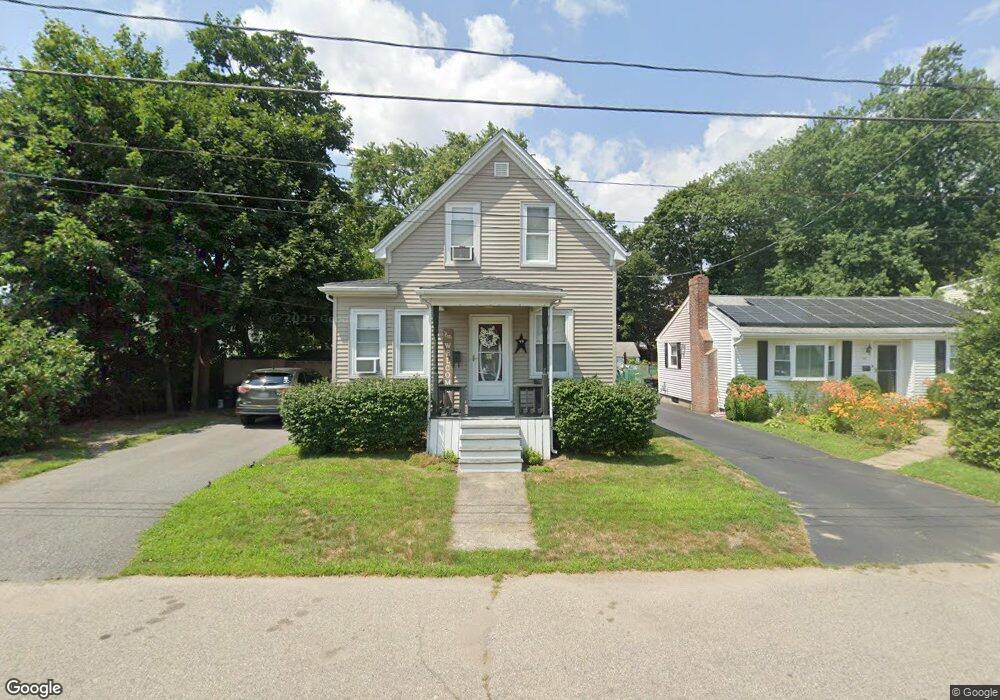
49 Martin St Brockton, MA 02302
Estimated Value: $439,000 - $462,750
2
Beds
1
Bath
1,001
Sq Ft
$453/Sq Ft
Est. Value
About This Home
This home is located at 49 Martin St, Brockton, MA 02302 and is currently estimated at $453,188, approximately $452 per square foot. 49 Martin St is a home located in Plymouth County with nearby schools including Brookfield Elementary School, Downey Elementary School, and Ashfield Middle School.
Ownership History
Date
Name
Owned For
Owner Type
Purchase Details
Closed on
Nov 17, 2014
Sold by
Evergreen Ventures Llc
Bought by
Cain Jeffrey and Cain Danyel
Current Estimated Value
Home Financials for this Owner
Home Financials are based on the most recent Mortgage that was taken out on this home.
Original Mortgage
$186,459
Outstanding Balance
$144,758
Interest Rate
4.37%
Mortgage Type
FHA
Estimated Equity
$308,430
Purchase Details
Closed on
Aug 13, 2010
Sold by
Taylor Bean and Taylor Whitaker M
Bought by
Evergreen Ventures Llc
Purchase Details
Closed on
Jan 10, 2008
Sold by
Carter-Rodrigue Steven
Bought by
Taylor Bean & Whitker Mt
Purchase Details
Closed on
Feb 26, 2007
Sold by
Rodrigue Steven C and Rodrigue Karen M
Bought by
Rodrigue Steven C
Home Financials for this Owner
Home Financials are based on the most recent Mortgage that was taken out on this home.
Original Mortgage
$240,000
Interest Rate
6.23%
Mortgage Type
Purchase Money Mortgage
Create a Home Valuation Report for This Property
The Home Valuation Report is an in-depth analysis detailing your home's value as well as a comparison with similar homes in the area
Home Values in the Area
Average Home Value in this Area
Purchase History
| Date | Buyer | Sale Price | Title Company |
|---|---|---|---|
| Cain Jeffrey | $189,900 | -- | |
| Evergreen Ventures Llc | $63,000 | -- | |
| Taylor Bean & Whitker Mt | $225,000 | -- | |
| Rodrigue Steven C | -- | -- |
Source: Public Records
Mortgage History
| Date | Status | Borrower | Loan Amount |
|---|---|---|---|
| Open | Cain Jeffrey | $186,459 | |
| Previous Owner | Rodrigue Steven C | $130,000 | |
| Previous Owner | Rodrigue Steven C | $240,000 |
Source: Public Records
Tax History Compared to Growth
Tax History
| Year | Tax Paid | Tax Assessment Tax Assessment Total Assessment is a certain percentage of the fair market value that is determined by local assessors to be the total taxable value of land and additions on the property. | Land | Improvement |
|---|---|---|---|---|
| 2025 | $5,045 | $416,600 | $140,100 | $276,500 |
| 2024 | $4,886 | $406,500 | $140,100 | $266,400 |
| 2023 | $4,512 | $347,600 | $104,600 | $243,000 |
| 2022 | $4,525 | $323,900 | $95,100 | $228,800 |
| 2021 | $4,244 | $292,700 | $79,100 | $213,600 |
| 2020 | $3,342 | $220,600 | $74,000 | $146,600 |
| 2019 | $3,523 | $226,700 | $72,200 | $154,500 |
| 2018 | $3,145 | $195,800 | $72,200 | $123,600 |
| 2017 | $2,961 | $183,900 | $72,200 | $111,700 |
| 2016 | $2,908 | $167,500 | $70,000 | $97,500 |
| 2015 | $2,212 | $121,900 | $70,000 | $51,900 |
| 2014 | $2,344 | $129,300 | $70,000 | $59,300 |
Source: Public Records
Map
Nearby Homes