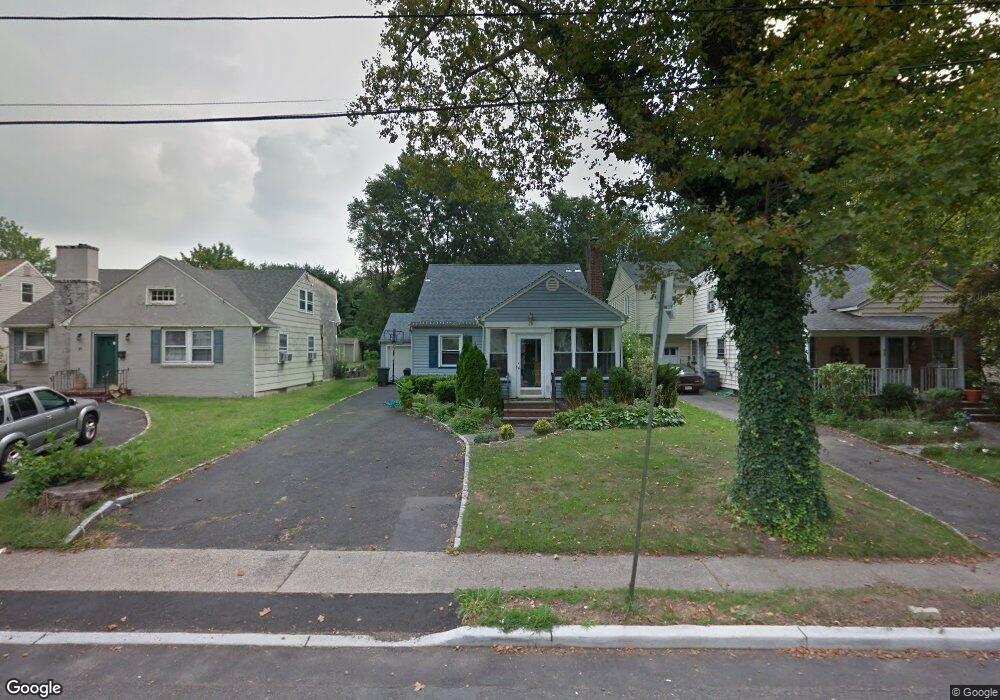
49 Meisel Ave Springfield, NJ 07081
Estimated Value: $516,807 - $611,000
Studio
--
Bath
1,383
Sq Ft
$414/Sq Ft
Est. Value
About This Home
This home is located at 49 Meisel Ave, Springfield, NJ 07081 and is currently estimated at $572,452, approximately $413 per square foot. 49 Meisel Ave is a home located in Union County with nearby schools including Jonathan Dayton High School and St James The Apostle School.
Ownership History
Date
Name
Owned For
Owner Type
Purchase Details
Closed on
Oct 21, 2005
Sold by
Vozza Steven R
Bought by
Ulizio Wilmer and Ulizio Nancy
Current Estimated Value
Home Financials for this Owner
Home Financials are based on the most recent Mortgage that was taken out on this home.
Original Mortgage
$203,000
Outstanding Balance
$108,381
Interest Rate
5.72%
Mortgage Type
FHA
Estimated Equity
$464,071
Purchase Details
Closed on
Aug 27, 2001
Sold by
Oshri Lior and Oshri Donna
Bought by
Vozza Steven R and Vozza Maria C
Home Financials for this Owner
Home Financials are based on the most recent Mortgage that was taken out on this home.
Original Mortgage
$191,900
Interest Rate
7.06%
Purchase Details
Closed on
Mar 12, 1997
Sold by
Kupersmith Carl
Bought by
Oshri Lior
Home Financials for this Owner
Home Financials are based on the most recent Mortgage that was taken out on this home.
Original Mortgage
$122,000
Interest Rate
7.68%
Create a Home Valuation Report for This Property
The Home Valuation Report is an in-depth analysis detailing your home's value as well as a comparison with similar homes in the area
Home Values in the Area
Average Home Value in this Area
Purchase History
| Date | Buyer | Sale Price | Title Company |
|---|---|---|---|
| Ulizio Wilmer | $405,000 | -- | |
| Vozza Steven R | $239,900 | Chicago Title Insurance Co | |
| Oshri Lior | $137,000 | -- |
Source: Public Records
Mortgage History
| Date | Status | Borrower | Loan Amount |
|---|---|---|---|
| Open | Ulizio Wilmer | $203,000 | |
| Previous Owner | Vozza Steven R | $191,900 | |
| Previous Owner | Oshri Lior | $122,000 |
Source: Public Records
Tax History
| Year | Tax Paid | Tax Assessment Tax Assessment Total Assessment is a certain percentage of the fair market value that is determined by local assessors to be the total taxable value of land and additions on the property. | Land | Improvement |
|---|---|---|---|---|
| 2025 | $9,431 | $397,100 | $196,700 | $200,400 |
| 2024 | $9,276 | $397,100 | $196,700 | $200,400 |
| 2023 | $9,276 | $397,100 | $196,700 | $200,400 |
| 2022 | $8,613 | $397,100 | $196,700 | $200,400 |
| 2021 | $8,964 | $120,400 | $43,300 | $77,100 |
| 2020 | $8,824 | $120,400 | $43,300 | $77,100 |
| 2019 | $8,705 | $120,400 | $43,300 | $77,100 |
| 2018 | $8,548 | $120,400 | $43,300 | $77,100 |
| 2017 | $8,314 | $120,400 | $43,300 | $77,100 |
| 2016 | $8,152 | $120,400 | $43,300 | $77,100 |
| 2015 | $8,057 | $120,400 | $43,300 | $77,100 |
| 2014 | $7,905 | $120,400 | $43,300 | $77,100 |
Source: Public Records
Map
Nearby Homes
- 20 Maple Ave
- 38 Warner Ave
- 67 Battle Hill Ave
- 1 Perry Place
- 182 Meisel Ave
- 105 Battle Hill Ave
- 24 Brook St
- 298 Main St
- 148 Locust Dr
- 19A Ocean St Unit A
- 823 Pinewood Rd
- 45 Ocean St Unit B
- 8 Willow St
- 7 Willow St
- 2785 Larchmont Rd
- 1042 Battle Hill Terrace
- 27 Willow St Unit A
- 750 Andover Rd
- 28 Molter Ave
- 968 Moessner Ave
Your Personal Tour Guide
Ask me questions while you tour the home.