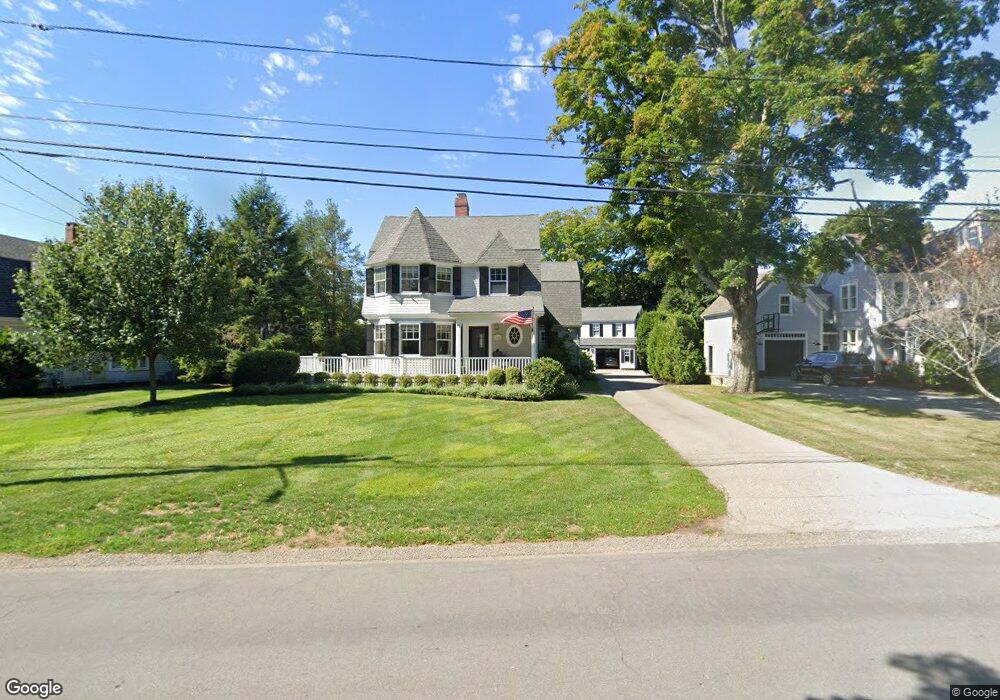
49 Middle St Hingham, MA 02043
Estimated Value: $2,769,547 - $3,191,000
4
Beds
4
Baths
4,900
Sq Ft
$601/Sq Ft
Est. Value
About This Home
This home is located at 49 Middle St, Hingham, MA 02043 and is currently estimated at $2,946,516, approximately $601 per square foot. 49 Middle St is a home located in Plymouth County with nearby schools including East Elementary School, Hingham Middle School, and Hingham High School.
Ownership History
Date
Name
Owned For
Owner Type
Purchase Details
Closed on
Apr 19, 2016
Sold by
Frank Andrew J and Frank Kyra B
Bought by
Frank Ft
Current Estimated Value
Purchase Details
Closed on
Apr 13, 2016
Sold by
Frank Ft
Bought by
Frank Andrew J and Frank Kyra B
Purchase Details
Closed on
Jul 3, 2014
Sold by
Frank Andrew J and Frank Kyra
Bought by
Frank Ft and Frank Andrew J
Purchase Details
Closed on
May 20, 2014
Sold by
Frank Ft and Frank Andrew X
Bought by
Frank Andrew X and Frank Kyra
Purchase Details
Closed on
Jul 21, 2010
Sold by
Frank Andrew J and Frank Kyra
Bought by
Frank Ft and Frank Andrew J
Purchase Details
Closed on
Jun 1, 2007
Sold by
Maisto Mark
Bought by
Frank Andrew J and Frank Kyra
Home Financials for this Owner
Home Financials are based on the most recent Mortgage that was taken out on this home.
Original Mortgage
$1,250,000
Interest Rate
6.24%
Mortgage Type
Purchase Money Mortgage
Purchase Details
Closed on
Dec 8, 2005
Sold by
Manley Mary H
Bought by
Maisto Mark
Create a Home Valuation Report for This Property
The Home Valuation Report is an in-depth analysis detailing your home's value as well as a comparison with similar homes in the area
Purchase History
| Date | Buyer | Sale Price | Title Company |
|---|---|---|---|
| Frank Ft | -- | -- | |
| Frank Andrew J | -- | -- | |
| Frank Ft | -- | -- | |
| Frank Andrew X | -- | -- | |
| Frank Ft | -- | -- | |
| Frank Andrew J | $2,225,000 | -- | |
| Maisto Mark | $1,075,000 | -- |
Source: Public Records
Mortgage History
| Date | Status | Borrower | Loan Amount |
|---|---|---|---|
| Previous Owner | Maisto Mark | $980,000 | |
| Previous Owner | Maisto Mark | $1,250,000 | |
| Previous Owner | Maisto Mark | $900,000 |
Source: Public Records
Tax History
| Year | Tax Paid | Tax Assessment Tax Assessment Total Assessment is a certain percentage of the fair market value that is determined by local assessors to be the total taxable value of land and additions on the property. | Land | Improvement |
|---|---|---|---|---|
| 2025 | $25,173 | $2,354,800 | $794,000 | $1,560,800 |
| 2024 | $25,207 | $2,323,200 | $794,000 | $1,529,200 |
| 2023 | $22,380 | $2,238,000 | $794,000 | $1,444,000 |
| 2022 | $21,981 | $1,901,500 | $721,800 | $1,179,700 |
| 2021 | $21,443 | $1,817,200 | $681,700 | $1,135,500 |
| 2020 | $20,729 | $1,797,800 | $681,700 | $1,116,100 |
| 2019 | $21,008 | $1,778,800 | $681,700 | $1,097,100 |
| 2018 | $20,563 | $1,747,100 | $681,700 | $1,065,400 |
| 2017 | $17,901 | $1,461,300 | $601,500 | $859,800 |
| 2016 | $17,894 | $1,432,700 | $572,900 | $859,800 |
| 2015 | $17,840 | $1,423,800 | $564,000 | $859,800 |
Source: Public Records
Map
Nearby Homes
Your Personal Tour Guide
Ask me questions while you tour the home.