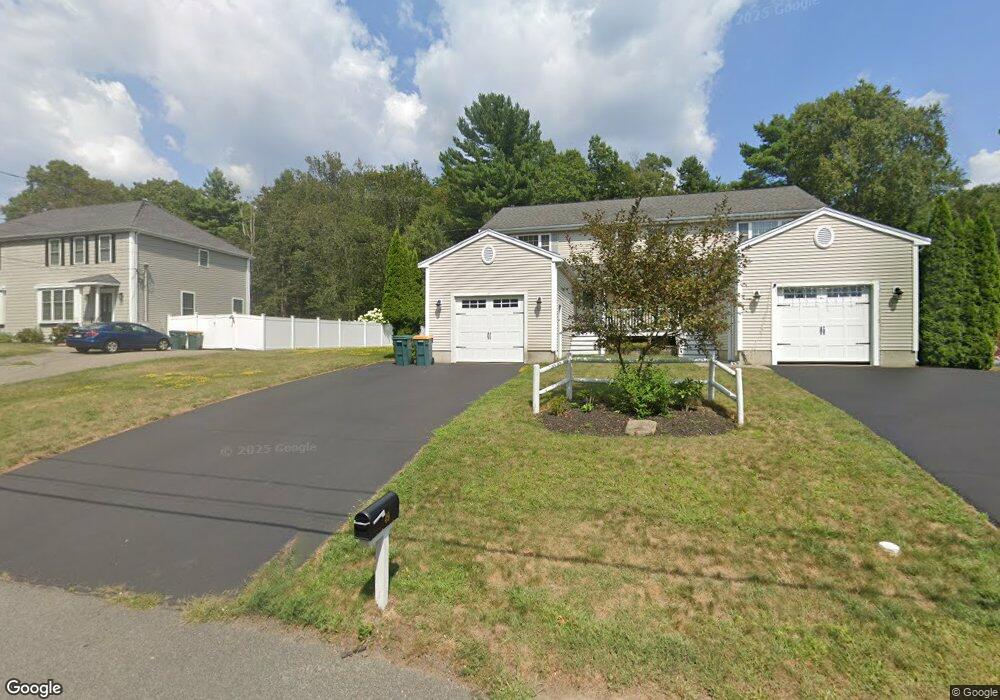
49 Mill St Abington, MA 02351
Estimated Value: $501,095 - $547,000
2
Beds
2
Baths
1,560
Sq Ft
$337/Sq Ft
Est. Value
About This Home
This home is located at 49 Mill St, Abington, MA 02351 and is currently estimated at $526,024, approximately $337 per square foot. 49 Mill St is a home located in Plymouth County with nearby schools including Beaver Brook Elementary School, Abington Middle School, and Woodsdale School.
Ownership History
Date
Name
Owned For
Owner Type
Purchase Details
Closed on
Jul 30, 2009
Sold by
Brown Justin and Brown Jody L
Bought by
Giglia Julie
Current Estimated Value
Home Financials for this Owner
Home Financials are based on the most recent Mortgage that was taken out on this home.
Original Mortgage
$206,972
Interest Rate
5.43%
Mortgage Type
Purchase Money Mortgage
Purchase Details
Closed on
Jul 31, 2007
Sold by
J&S Rt and Crowley Jared
Bought by
Brown Justin and Gardner Jody L
Home Financials for this Owner
Home Financials are based on the most recent Mortgage that was taken out on this home.
Original Mortgage
$243,200
Interest Rate
6.78%
Mortgage Type
Purchase Money Mortgage
Purchase Details
Closed on
Jul 5, 2007
Sold by
Focus Invest Rt
Bought by
J & S Rt
Home Financials for this Owner
Home Financials are based on the most recent Mortgage that was taken out on this home.
Original Mortgage
$243,200
Interest Rate
6.78%
Mortgage Type
Purchase Money Mortgage
Create a Home Valuation Report for This Property
The Home Valuation Report is an in-depth analysis detailing your home's value as well as a comparison with similar homes in the area
Home Values in the Area
Average Home Value in this Area
Purchase History
| Date | Buyer | Sale Price | Title Company |
|---|---|---|---|
| Giglia Julie | $276,000 | -- | |
| Brown Justin | $304,000 | -- | |
| J & S Rt | -- | -- |
Source: Public Records
Mortgage History
| Date | Status | Borrower | Loan Amount |
|---|---|---|---|
| Open | Brown Justin | $210,000 | |
| Closed | Brown Justin | $206,972 | |
| Previous Owner | Brown Justin | $243,200 |
Source: Public Records
Tax History
| Year | Tax Paid | Tax Assessment Tax Assessment Total Assessment is a certain percentage of the fair market value that is determined by local assessors to be the total taxable value of land and additions on the property. | Land | Improvement |
|---|---|---|---|---|
| 2025 | $6,164 | $472,000 | $0 | $472,000 |
| 2024 | $5,814 | $434,500 | $0 | $434,500 |
| 2023 | $5,810 | $408,900 | $0 | $408,900 |
| 2022 | $5,700 | $374,500 | $0 | $374,500 |
| 2021 | $5,191 | $315,000 | $0 | $315,000 |
| 2020 | $5,171 | $304,200 | $0 | $304,200 |
| 2019 | $5,022 | $288,800 | $0 | $288,800 |
| 2018 | $5,146 | $288,800 | $0 | $288,800 |
| 2017 | $5,299 | $288,800 | $0 | $288,800 |
| 2016 | $4,972 | $277,300 | $0 | $277,300 |
| 2015 | $4,423 | $260,200 | $0 | $260,200 |
Source: Public Records
Map
Nearby Homes
- 877 Brockton Ave Unit 877
- 28 Linda St
- 78 Linda St
- 76 Short St
- 151 Windsor Dr
- 25 Courtfield Dr
- 360 High St
- 126 Bates Rd
- 88 Pinehurst Ave
- 11 Russell Rd
- 135 Guild Rd
- 2 Dundee St
- 82 Debbie Rd Unit Lot 18
- 90 Loring Ave
- 104 Crestfield Dr
- 34 Guild Rd
- 43 Pinehurst Ave
- 9 Karen Ln
- 72 Crestfield Terrace
- 27 Austin Ct Unit Lot 6
Your Personal Tour Guide
Ask me questions while you tour the home.