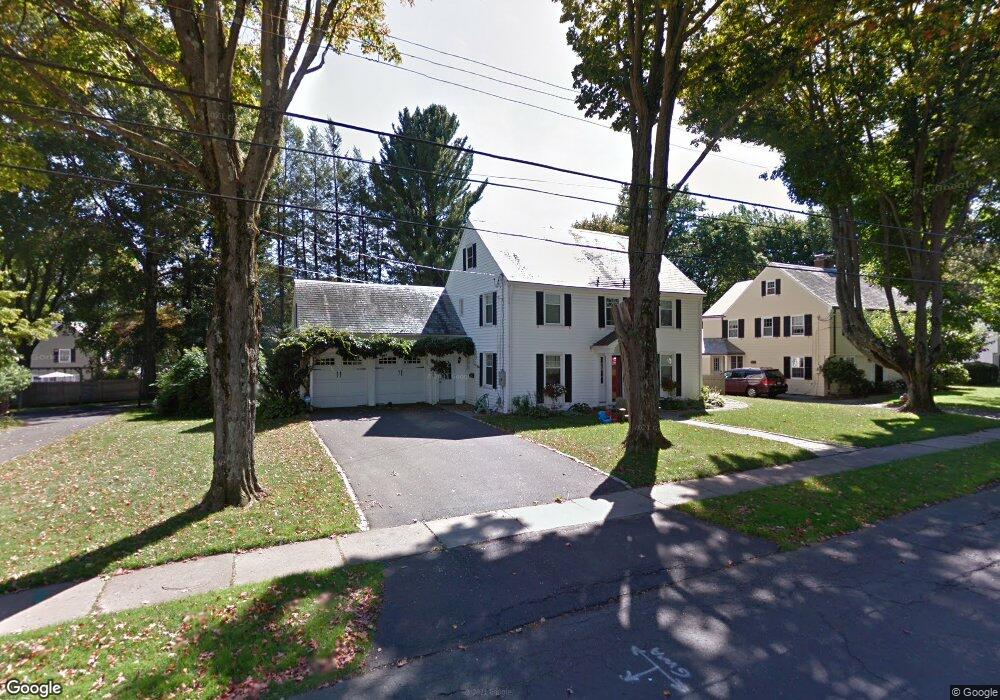
49 Mountain View Dr West Hartford, CT 06117
Estimated Value: $822,000 - $999,000
4
Beds
4
Baths
2,528
Sq Ft
$358/Sq Ft
Est. Value
About This Home
This home is located at 49 Mountain View Dr, West Hartford, CT 06117 and is currently estimated at $905,473, approximately $358 per square foot. 49 Mountain View Dr is a home located in Hartford County with nearby schools including Bugbee School, King Philip Middle School, and Hall High School.
Ownership History
Date
Name
Owned For
Owner Type
Purchase Details
Closed on
Jun 4, 2007
Sold by
Jepsen George C and Sousa Diana
Bought by
Esterson Brett D and Esterson Jessica B
Current Estimated Value
Home Financials for this Owner
Home Financials are based on the most recent Mortgage that was taken out on this home.
Original Mortgage
$417,000
Interest Rate
6.24%
Purchase Details
Closed on
Apr 30, 2003
Sold by
Mcleod Barbara B
Bought by
Jepsen George C and Jepsen Diana Sousa
Purchase Details
Closed on
Jan 6, 1998
Sold by
Ustach Daniel H and Ustach Mary Ann
Bought by
Bakke Jessica M
Purchase Details
Closed on
Apr 5, 1988
Sold by
Hillside Assocs
Bought by
Simons Richard
Create a Home Valuation Report for This Property
The Home Valuation Report is an in-depth analysis detailing your home's value as well as a comparison with similar homes in the area
Home Values in the Area
Average Home Value in this Area
Purchase History
| Date | Buyer | Sale Price | Title Company |
|---|---|---|---|
| Esterson Brett D | $621,000 | -- | |
| Jepsen George C | $420,000 | -- | |
| Bakke Jessica M | $195,000 | -- | |
| Simons Richard | $85,900 | -- |
Source: Public Records
Mortgage History
| Date | Status | Borrower | Loan Amount |
|---|---|---|---|
| Open | Simons Richard | $402,914 | |
| Closed | Simons Richard | $417,000 | |
| Closed | Simons Richard | $417,000 |
Source: Public Records
Tax History Compared to Growth
Tax History
| Year | Tax Paid | Tax Assessment Tax Assessment Total Assessment is a certain percentage of the fair market value that is determined by local assessors to be the total taxable value of land and additions on the property. | Land | Improvement |
|---|---|---|---|---|
| 2025 | $15,497 | $346,080 | $121,520 | $224,560 |
| 2024 | $14,656 | $346,080 | $121,520 | $224,560 |
| 2023 | $14,162 | $346,080 | $121,520 | $224,560 |
| 2022 | $14,079 | $346,080 | $121,520 | $224,560 |
| 2021 | $12,611 | $297,290 | $121,520 | $175,770 |
| 2020 | $12,038 | $287,980 | $113,750 | $174,230 |
| 2019 | $12,038 | $287,980 | $113,750 | $174,230 |
| 2018 | $11,807 | $287,980 | $113,750 | $174,230 |
| 2017 | $11,819 | $287,980 | $113,750 | $174,230 |
| 2016 | $13,538 | $342,650 | $119,280 | $223,370 |
| 2015 | $13,127 | $342,650 | $119,280 | $223,370 |
| 2014 | $12,805 | $342,650 | $119,280 | $223,370 |
Source: Public Records
Map
Nearby Homes
- 62 Blue Ridge Ln
- 47 Flagg Rd
- 2581 Albany Ave
- 56 Fox Chase Ln
- 30 Farmstead Ln
- 50 Magnolia Hill
- 132 N Main St
- 11 Rye Ridge Pkwy
- 26 Berwyn Rd
- 129 Middlebrook Rd
- 1272 Trout Brook Dr
- 592 Mountain Rd Unit A
- 37 W Normandy Dr
- 11 Lawler Rd
- 1196 Trout Brook Dr
- 139 Mohawk Dr
- 183 Loomis Dr Unit 109
- 21 Barksdale Rd
- 1110 Trout Brook Dr
- 124 High Ridge Rd
- 53 Mountain View Dr
- 45 Mountain View Dr
- 1910 Asylum Ave
- 1914 Asylum Ave
- 57 Mountain View Dr
- 1908 Asylum Ave
- 52 Mountain View Dr
- 48 Mountain View Dr
- 1916 Asylum Ave
- 1904 Asylum Ave
- 56 Mountain View Dr
- 46 Mountain View Dr
- 61 Mountain View Dr
- 39 Mountain View Dr
- 1902 Asylum Ave
- 42 Mountain View Dr
- 60 Mountain View Dr
- 2 Harvest Ln
- 8 Harvest Ln
- 8 Harvest Ln Unit 8