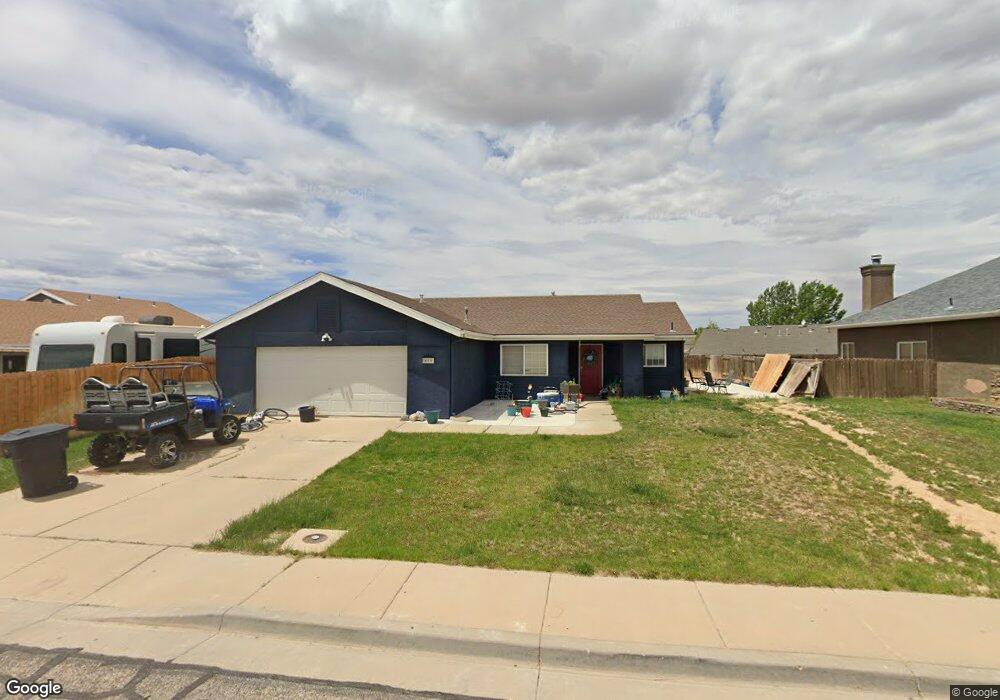
49 N 4125 W Cedar City, UT 84720
Estimated Value: $309,810 - $386,000
--
Bed
--
Bath
1,180
Sq Ft
$305/Sq Ft
Est. Value
About This Home
This home is located at 49 N 4125 W, Cedar City, UT 84720 and is currently estimated at $359,703, approximately $304 per square foot. 49 N 4125 W is a home located in Iron County with nearby schools including Iron Springs School, Cedar Middle School, and Cedar City High School.
Ownership History
Date
Name
Owned For
Owner Type
Purchase Details
Closed on
Jan 24, 2022
Sold by
Halterman Randolph N
Bought by
Fischer Deborah Jayne Donoho and Halterman Vicki L
Current Estimated Value
Home Financials for this Owner
Home Financials are based on the most recent Mortgage that was taken out on this home.
Original Mortgage
$100,000
Outstanding Balance
$92,351
Interest Rate
3.11%
Mortgage Type
New Conventional
Estimated Equity
$267,352
Purchase Details
Closed on
Oct 7, 2021
Sold by
R & V Properties Llc
Bought by
Halterman Randolph N and Halterman Vicki L
Purchase Details
Closed on
Dec 2, 2008
Sold by
Halterman Randolph N and Halterman Vicki L
Bought by
R & V Properties Llc
Purchase Details
Closed on
May 8, 2006
Sold by
Mcilnay Travis and Mcilnay Jennifer L
Bought by
Halterman Randolph N and Halterman Vicki L
Create a Home Valuation Report for This Property
The Home Valuation Report is an in-depth analysis detailing your home's value as well as a comparison with similar homes in the area
Home Values in the Area
Average Home Value in this Area
Purchase History
| Date | Buyer | Sale Price | Title Company |
|---|---|---|---|
| Fischer Deborah Jayne Donoho | -- | Security Escrow & Title | |
| Halterman Randolph N | -- | -- | |
| R & V Properties Llc | -- | -- | |
| Halterman Randolph N | -- | -- |
Source: Public Records
Mortgage History
| Date | Status | Borrower | Loan Amount |
|---|---|---|---|
| Open | Fischer Deborah Jayne Donoho | $100,000 |
Source: Public Records
Tax History Compared to Growth
Tax History
| Year | Tax Paid | Tax Assessment Tax Assessment Total Assessment is a certain percentage of the fair market value that is determined by local assessors to be the total taxable value of land and additions on the property. | Land | Improvement |
|---|---|---|---|---|
| 2025 | $1,187 | $152,546 | $36,529 | $116,017 |
| 2023 | $1,179 | $155,110 | $31,765 | $123,345 |
| 2022 | $1,338 | $145,580 | $28,110 | $117,470 |
| 2021 | $1,085 | $117,985 | $15,615 | $102,370 |
| 2020 | $1,039 | $100,220 | $15,615 | $84,605 |
| 2019 | $1,003 | $92,530 | $15,615 | $76,915 |
| 2018 | $1,021 | $91,110 | $14,195 | $76,915 |
| 2017 | $867 | $76,200 | $10,950 | $65,250 |
| 2016 | $853 | $69,760 | $8,860 | $60,900 |
| 2015 | $848 | $65,780 | $0 | $0 |
| 2014 | $858 | $62,295 | $0 | $0 |
Source: Public Records
Map
Nearby Homes