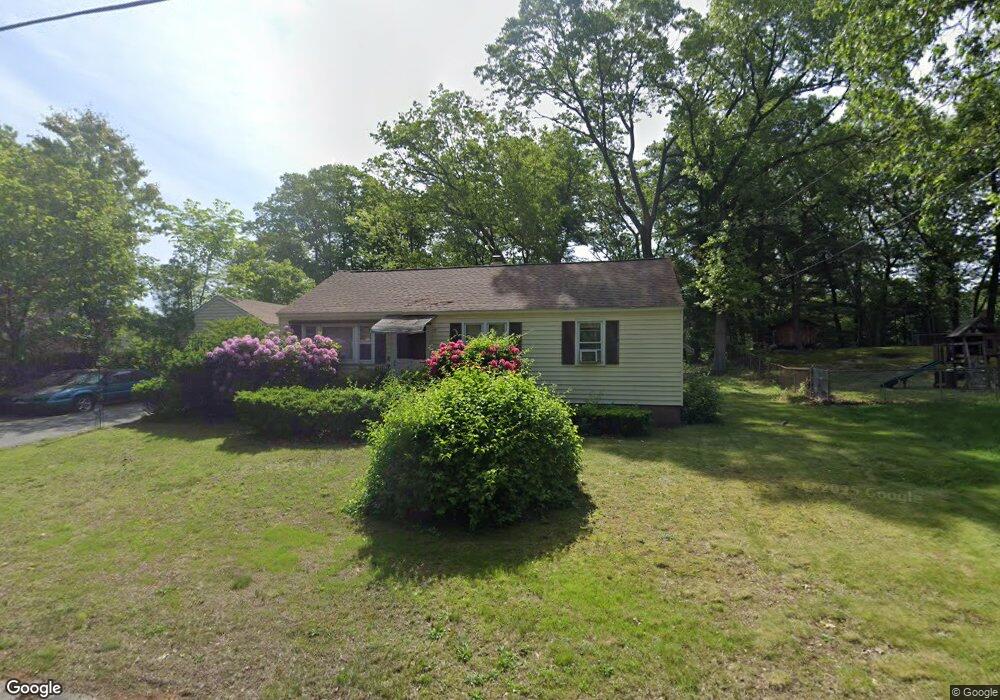
49 N Branch Pkwy Springfield, MA 01119
Sixteen Acres NeighborhoodEstimated Value: $268,000 - $315,000
3
Beds
2
Baths
1,000
Sq Ft
$302/Sq Ft
Est. Value
About This Home
This home is located at 49 N Branch Pkwy, Springfield, MA 01119 and is currently estimated at $301,714, approximately $301 per square foot. 49 N Branch Pkwy is a home located in Hampden County with nearby schools including Mary M. Lynch Elementary School, John J Duggan Middle, and Springfield Central High School.
Ownership History
Date
Name
Owned For
Owner Type
Purchase Details
Closed on
Mar 29, 1996
Sold by
Braska Robert R and Braska Marguerite M
Bought by
Pete Lea O
Current Estimated Value
Home Financials for this Owner
Home Financials are based on the most recent Mortgage that was taken out on this home.
Original Mortgage
$27,900
Outstanding Balance
$1,257
Interest Rate
6.9%
Mortgage Type
Purchase Money Mortgage
Estimated Equity
$300,457
Create a Home Valuation Report for This Property
The Home Valuation Report is an in-depth analysis detailing your home's value as well as a comparison with similar homes in the area
Home Values in the Area
Average Home Value in this Area
Purchase History
| Date | Buyer | Sale Price | Title Company |
|---|---|---|---|
| Pete Lea O | $82,900 | -- |
Source: Public Records
Mortgage History
| Date | Status | Borrower | Loan Amount |
|---|---|---|---|
| Open | Pete Lea O | $27,900 | |
| Previous Owner | Pete Lea O | $26,000 |
Source: Public Records
Tax History Compared to Growth
Tax History
| Year | Tax Paid | Tax Assessment Tax Assessment Total Assessment is a certain percentage of the fair market value that is determined by local assessors to be the total taxable value of land and additions on the property. | Land | Improvement |
|---|---|---|---|---|
| 2025 | $3,886 | $247,800 | $56,000 | $191,800 |
| 2024 | $3,488 | $217,200 | $56,000 | $161,200 |
| 2023 | $3,424 | $200,800 | $53,300 | $147,500 |
| 2022 | $3,335 | $177,200 | $53,300 | $123,900 |
| 2021 | $3,052 | $161,500 | $48,500 | $113,000 |
| 2020 | $2,937 | $150,400 | $48,500 | $101,900 |
| 2019 | $2,816 | $143,100 | $48,500 | $94,600 |
| 2018 | $2,800 | $142,300 | $48,500 | $93,800 |
| 2017 | $2,717 | $138,200 | $48,100 | $90,100 |
| 2016 | $2,642 | $134,400 | $48,100 | $86,300 |
| 2015 | $2,516 | $127,900 | $48,100 | $79,800 |
Source: Public Records
Map
Nearby Homes
- 41 N Branch Pkwy
- 59 N Branch Pkwy
- 92 Juniper Dr
- 31 N Branch Pkwy
- 102 Juniper Dr
- 84 Juniper Dr
- 67 N Branch Pkwy
- 76 Juniper Dr
- 32 N Brook Rd
- 19 N Branch Pkwy
- 52 N Brook Rd
- 77 N Branch Pkwy
- 24 N Brook Rd
- 66 Juniper Dr
- 14 N Brook Rd
- 89 Juniper Dr
- 99 Juniper Dr
- 81 Juniper Dr
- 64 N Brook Rd
- 85 N Branch Pkwy