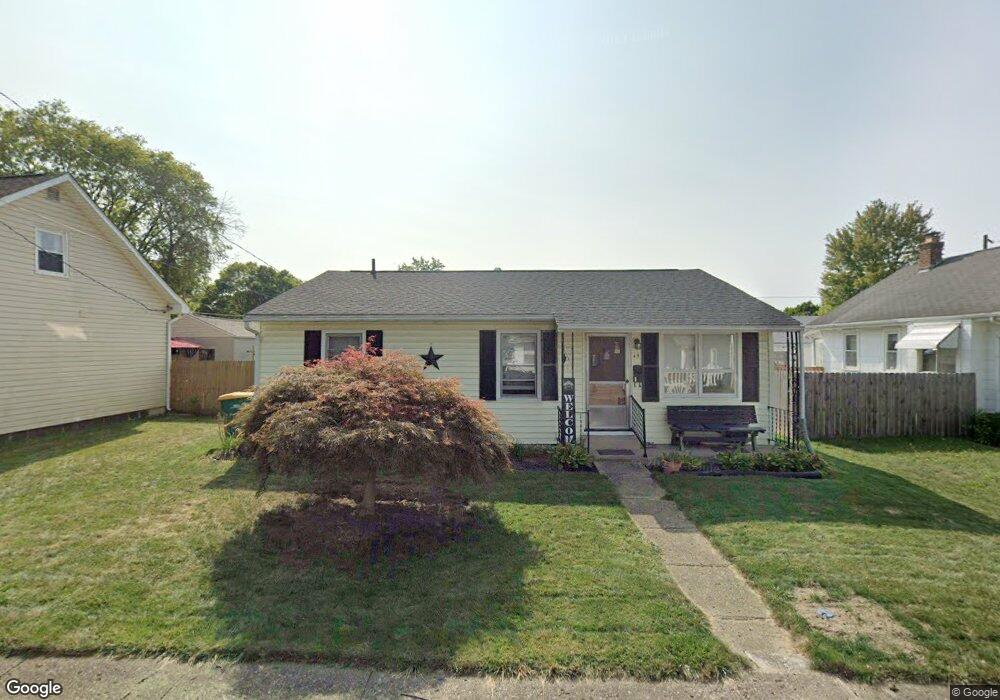
49 N Franklin St West Jefferson, OH 43162
Estimated Value: $173,078 - $206,000
3
Beds
1
Bath
1,008
Sq Ft
$189/Sq Ft
Est. Value
About This Home
This home is located at 49 N Franklin St, West Jefferson, OH 43162 and is currently estimated at $190,270, approximately $188 per square foot. 49 N Franklin St is a home located in Madison County with nearby schools including Norwood Elementary School, West Jefferson Middle School, and West Jefferson High School.
Ownership History
Date
Name
Owned For
Owner Type
Purchase Details
Closed on
Dec 22, 2015
Sold by
Harbage Charles T and Harbage Connie E
Bought by
Smith Terri S Harbage
Current Estimated Value
Purchase Details
Closed on
Mar 3, 1998
Sold by
Price Glen E
Bought by
Harbage Charles T and Harbage Connor E
Home Financials for this Owner
Home Financials are based on the most recent Mortgage that was taken out on this home.
Original Mortgage
$74,690
Outstanding Balance
$13,089
Interest Rate
7.25%
Mortgage Type
New Conventional
Estimated Equity
$177,181
Purchase Details
Closed on
Sep 14, 1994
Sold by
Price William
Bought by
Price Glenn E and Price Joan L
Purchase Details
Closed on
Nov 16, 1993
Sold by
Wendel Sm and Wendel Dora
Bought by
Price William Et At
Purchase Details
Closed on
Nov 15, 1993
Sold by
Ball Ball A A and Ball Humphrey Dorthy
Bought by
Wendall George and Dora Lee
Create a Home Valuation Report for This Property
The Home Valuation Report is an in-depth analysis detailing your home's value as well as a comparison with similar homes in the area
Home Values in the Area
Average Home Value in this Area
Purchase History
| Date | Buyer | Sale Price | Title Company |
|---|---|---|---|
| Smith Terri S Harbage | -- | Attorney | |
| Harbage Charles T | $77,000 | -- | |
| Price Glenn E | $60,000 | -- | |
| Price William Et At | $63,600 | -- | |
| Wendall George | $63,600 | -- |
Source: Public Records
Mortgage History
| Date | Status | Borrower | Loan Amount |
|---|---|---|---|
| Open | Harbage Charles T | $74,690 |
Source: Public Records
Tax History Compared to Growth
Tax History
| Year | Tax Paid | Tax Assessment Tax Assessment Total Assessment is a certain percentage of the fair market value that is determined by local assessors to be the total taxable value of land and additions on the property. | Land | Improvement |
|---|---|---|---|---|
| 2024 | $1,588 | $35,890 | $9,180 | $26,710 |
| 2023 | $1,588 | $35,890 | $9,180 | $26,710 |
| 2022 | $1,283 | $26,980 | $7,400 | $19,580 |
| 2021 | $1,288 | $26,980 | $7,400 | $19,580 |
| 2020 | $1,311 | $26,980 | $7,400 | $19,580 |
| 2019 | $1,217 | $24,670 | $6,910 | $17,760 |
| 2018 | $1,132 | $24,670 | $6,910 | $17,760 |
| 2017 | $1,134 | $24,670 | $6,910 | $17,760 |
| 2016 | $995 | $21,230 | $6,910 | $14,320 |
| 2015 | $611 | $21,230 | $6,910 | $14,320 |
| 2014 | $611 | $21,230 | $6,910 | $14,320 |
| 2013 | -- | $22,860 | $6,740 | $16,120 |
Source: Public Records
Map
Nearby Homes
- 304 Middle Dr
- 63 Jones St
- 622 Brookdale Dr
- 700 Shawn Dr Unit 88
- 0 W Jeff Kiousville Rd Unit 225000725
- 360 State Route 142 NE
- 125 Dogwood Ct
- 10763 Southwood Rd
- 8873 Canoe Dr
- 8830 Hubbard Dr N
- 8629 Canyon Cove Rd
- 8548 Canyon Cove Rd
- 749 Hubbard Rd
- 9519 High Free Pike
- 1890 Wilson Rd SE
- 8482 Dover Crest Ct
- 3150 Middle Pike
- 1280 Four Star Dr W
- 1278 Lieutenant Dr
- 0 Dellinger Rd Unit 9 2030113
- 53 N Franklin St
- 39 N Franklin St
- 35 N Franklin St
- 295 Darbyview Dr
- 63 N Franklin St
- 46 N Franklin St
- 54 N Franklin St
- 34 N Franklin St
- 69 N Franklin St
- 64 N Franklin St
- 301 Darbyview Dr
- 22 N Franklin St
- 276 W Main St
- 268 W Main St
- 284 W Main St
- 70 N Franklin St
- 53 N Hampton St
- 45 N Hampton St
- 77 N Franklin St
- 290 W Main St