49 N Kelsey St South Portland, ME 04106
Pleasantdale NeighborhoodEstimated Value: $605,000 - $689,000
3
Beds
1
Bath
2,100
Sq Ft
$307/Sq Ft
Est. Value
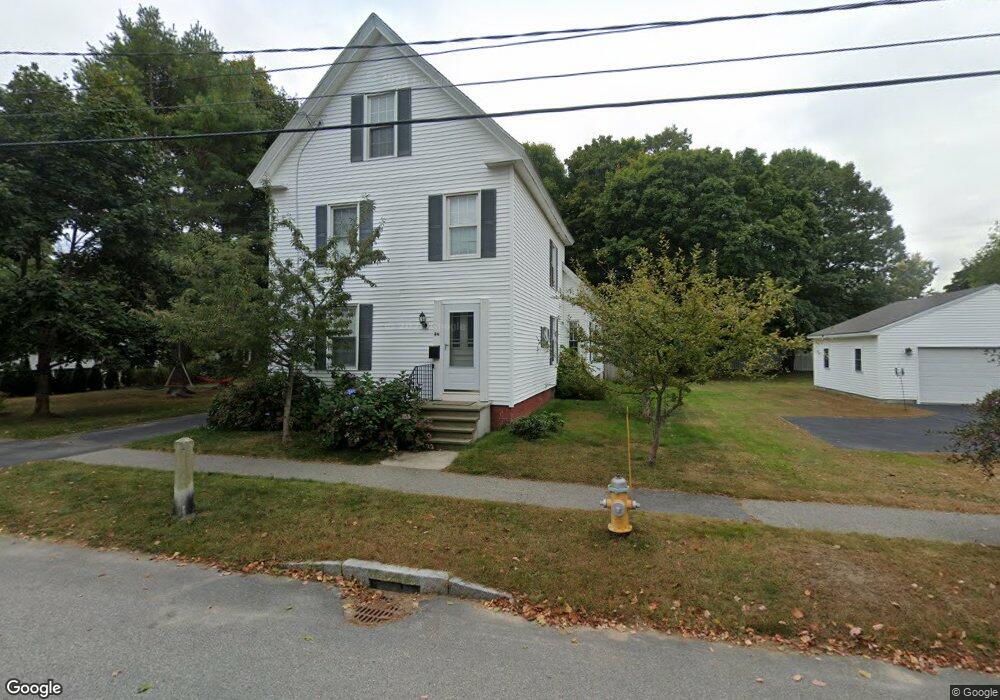
About This Home
This home is located at 49 N Kelsey St, South Portland, ME 04106 and is currently estimated at $644,659, approximately $306 per square foot. 49 N Kelsey St is a home located in Cumberland County with nearby schools including James Otis Kaler Elementary School, Coloma High School, and Greater Portland Christian School.
Ownership History
Date
Name
Owned For
Owner Type
Purchase Details
Closed on
Apr 26, 2011
Sold by
Matthews Ft
Bought by
Lindecamp Adrienne S and Lindecamp William
Current Estimated Value
Home Financials for this Owner
Home Financials are based on the most recent Mortgage that was taken out on this home.
Original Mortgage
$146,197
Outstanding Balance
$101,553
Interest Rate
4.87%
Mortgage Type
FHA
Estimated Equity
$543,106
Purchase Details
Closed on
Mar 30, 2007
Sold by
Matthews Alan P
Bought by
Matthews Alan P and Matthews Magdeleine B
Create a Home Valuation Report for This Property
The Home Valuation Report is an in-depth analysis detailing your home's value as well as a comparison with similar homes in the area
Home Values in the Area
Average Home Value in this Area
Purchase History
| Date | Buyer | Sale Price | Title Company |
|---|---|---|---|
| Lindecamp Adrienne S | -- | -- | |
| Matthews Alan P | -- | -- |
Source: Public Records
Mortgage History
| Date | Status | Borrower | Loan Amount |
|---|---|---|---|
| Open | Lindecamp Adrienne S | $146,197 |
Source: Public Records
Tax History Compared to Growth
Tax History
| Year | Tax Paid | Tax Assessment Tax Assessment Total Assessment is a certain percentage of the fair market value that is determined by local assessors to be the total taxable value of land and additions on the property. | Land | Improvement |
|---|---|---|---|---|
| 2024 | $6,980 | $528,800 | $175,600 | $353,200 |
| 2023 | $5,860 | $414,400 | $115,600 | $298,800 |
| 2022 | $5,644 | $362,700 | $92,600 | $270,100 |
| 2021 | $5,332 | $362,700 | $92,600 | $270,100 |
| 2020 | $4,845 | $245,300 | $80,100 | $165,200 |
| 2019 | $4,685 | $245,300 | $80,100 | $165,200 |
| 2018 | $4,675 | $252,700 | $80,100 | $172,600 |
| 2017 | $4,549 | $252,700 | $80,100 | $172,600 |
| 2016 | $4,473 | $252,700 | $80,100 | $172,600 |
| 2015 | $4,397 | $252,700 | $80,100 | $172,600 |
| 2014 | $4,150 | $252,700 | $80,100 | $172,600 |
| 2013 | -- | $208,700 | $80,100 | $128,600 |
Source: Public Records
Map
Nearby Homes
- 42 Reynolds St
- 11 Chestnut St
- 34 Minott St Unit B7
- 35 Palmer St
- 39 Morse St
- 66 Evans St Unit 3
- 404 Lincoln St
- 7 Allen Rd
- 1 Karynel Dr Unit 1
- 42 Buchanan St
- 1309 Broadway
- 17 b Peary Terrace
- 141 Mckinley St
- 11 Jackson St
- 56 Peary Terrace
- 311 Ocean St
- 338 Ocean St
- 360 Ocean St
- 13 Ocean St
- 18 Ocean St Unit 55