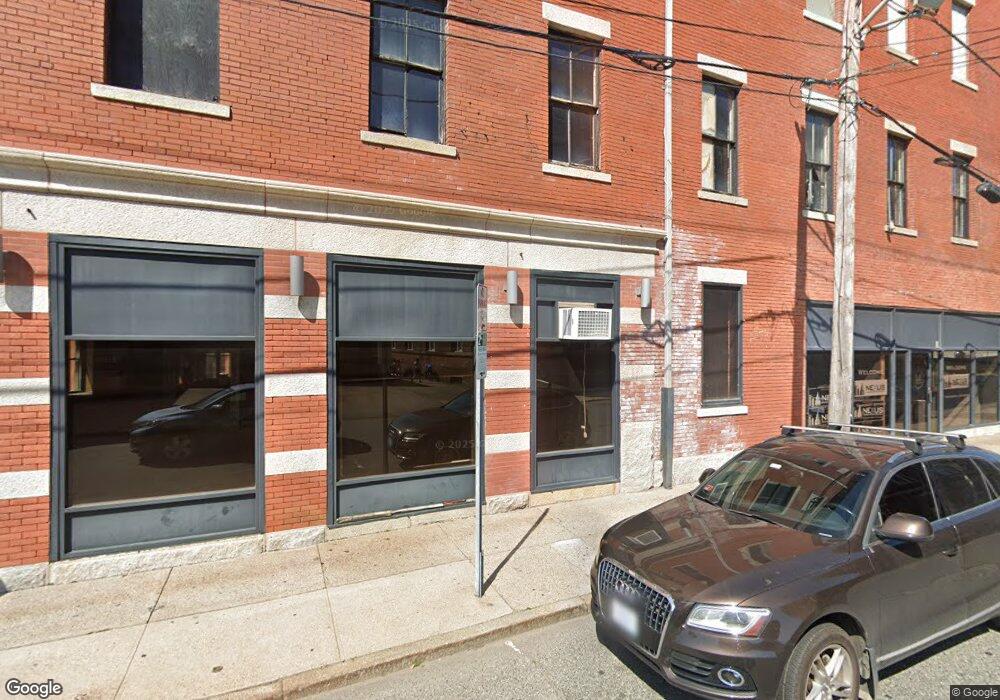
49 N Union St Pawtucket, RI 02860
Downtown Pawtucket NeighborhoodEstimated Value: $404,810
--
Bed
--
Bath
66,522
Sq Ft
$6/Sq Ft
Est. Value
About This Home
This home is located at 49 N Union St, Pawtucket, RI 02860 and is currently priced at $404,810, approximately $6 per square foot. 49 N Union St is a home located in Providence County with nearby schools including Trinity Academy for the Performing Arts and Dayspring Christian Academy.
Ownership History
Date
Name
Owned For
Owner Type
Purchase Details
Closed on
Dec 22, 2016
Sold by
Nexus Property Mgmt Ll
Bought by
Nexus Hld Llc
Current Estimated Value
Purchase Details
Closed on
Jul 3, 2014
Sold by
Major Electric Supply
Bought by
Nexus Property Mgmt Ll
Home Financials for this Owner
Home Financials are based on the most recent Mortgage that was taken out on this home.
Original Mortgage
$145,000
Interest Rate
4.16%
Mortgage Type
Commercial
Create a Home Valuation Report for This Property
The Home Valuation Report is an in-depth analysis detailing your home's value as well as a comparison with similar homes in the area
Home Values in the Area
Average Home Value in this Area
Purchase History
| Date | Buyer | Sale Price | Title Company |
|---|---|---|---|
| Nexus Hld Llc | -- | -- | |
| Nexus Property Mgmt Ll | $175,000 | -- |
Source: Public Records
Mortgage History
| Date | Status | Borrower | Loan Amount |
|---|---|---|---|
| Previous Owner | Nexus Property Mgmt Ll | $145,000 |
Source: Public Records
Tax History Compared to Growth
Tax History
| Year | Tax Paid | Tax Assessment Tax Assessment Total Assessment is a certain percentage of the fair market value that is determined by local assessors to be the total taxable value of land and additions on the property. | Land | Improvement |
|---|---|---|---|---|
| 2024 | $15,206 | $704,000 | $174,500 | $529,500 |
| 2023 | $16,714 | $563,700 | $145,700 | $418,000 |
| 2022 | $24,133 | $831,600 | $145,700 | $685,900 |
| 2021 | $16,359 | $563,700 | $145,700 | $418,000 |
| 2020 | $16,073 | $466,300 | $145,700 | $320,600 |
| 2019 | $16,073 | $466,300 | $145,700 | $320,600 |
| 2018 | $15,486 | $466,300 | $145,700 | $320,600 |
| 2017 | $16,432 | $471,100 | $141,800 | $329,300 |
| 2016 | $15,608 | $464,400 | $141,800 | $322,600 |
| 2015 | $15,608 | $464,400 | $141,800 | $322,600 |
| 2014 | $16,039 | $519,400 | $154,200 | $365,200 |
Source: Public Records
Map
Nearby Homes
- 28 Bayley St Unit 107
- 10 Exchange Ct Unit 506
- 78 Barton St
- 9 Nickerson St
- 75 Olive St
- 36 Underwood St
- 66 Underwood St
- 396 Roosevelt Ave
- 45 Harrison St
- 23 Garden St
- 44 West Ave
- 47 Grace St
- 44 Pawtucket Ave
- 166 Division St
- 59 West Ave
- 71 Lyon St
- 45 Denver St
- 14 Martin Ct
- 300 Front St Unit 209
- 300 Front St Unit 105
- 28 Summer St
- 110 High St Unit 203
- 110 High St Unit 103
- 110 High St Unit B
- 110 High St Unit 208
- 110 High St Unit 108
- 110 High St Unit 307
- 110 High St Unit 303
- 110 High St
- 9 Montgomery St
- 23 Exchange St
- 41 Summer St
- 33 Exchange St
- 17 Exchange St
- 27 Exchange St
- 69 Exchange St
- 8 Summer St
- 25 Broad St
- 3 Exchange St
- 23 Broad St