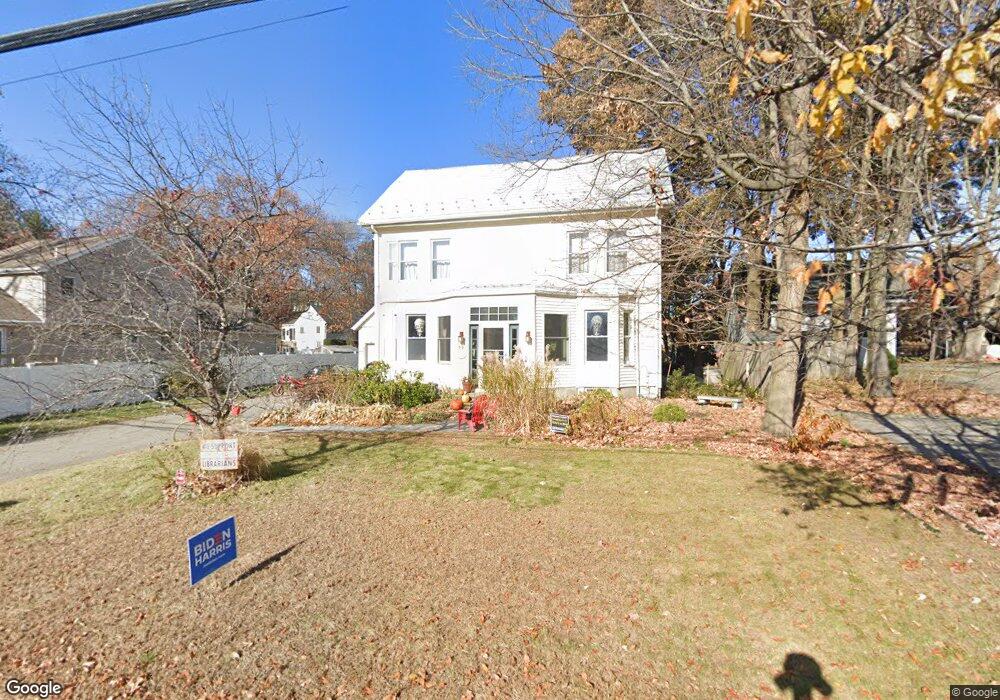
49 Nashua St Woburn, MA 01801
Downtown Woburn NeighborhoodEstimated Value: $773,859 - $829,000
4
Beds
2
Baths
1,780
Sq Ft
$453/Sq Ft
Est. Value
About This Home
This home is located at 49 Nashua St, Woburn, MA 01801 and is currently estimated at $805,715, approximately $452 per square foot. 49 Nashua St is a home located in Middlesex County with nearby schools including Goodyear Elementary School, John F. Kennedy Middle School, and Woburn High School.
Ownership History
Date
Name
Owned For
Owner Type
Purchase Details
Closed on
Apr 30, 1999
Sold by
Welch George E and Welch Mary T
Bought by
Harris George G and Harris Deshea L
Current Estimated Value
Home Financials for this Owner
Home Financials are based on the most recent Mortgage that was taken out on this home.
Original Mortgage
$194,900
Outstanding Balance
$49,983
Interest Rate
6.95%
Mortgage Type
Purchase Money Mortgage
Estimated Equity
$755,732
Purchase Details
Closed on
Jun 29, 1995
Sold by
Chiuchiolo Paul J and Chiuchiolo Elsa M
Bought by
Welch George E and Welch Mary T
Home Financials for this Owner
Home Financials are based on the most recent Mortgage that was taken out on this home.
Original Mortgage
$80,000
Interest Rate
7.8%
Mortgage Type
Purchase Money Mortgage
Create a Home Valuation Report for This Property
The Home Valuation Report is an in-depth analysis detailing your home's value as well as a comparison with similar homes in the area
Home Values in the Area
Average Home Value in this Area
Purchase History
| Date | Buyer | Sale Price | Title Company |
|---|---|---|---|
| Harris George G | $195,000 | -- | |
| Welch George E | $115,000 | -- |
Source: Public Records
Mortgage History
| Date | Status | Borrower | Loan Amount |
|---|---|---|---|
| Open | Welch George E | $194,900 | |
| Previous Owner | Welch George E | $80,000 | |
| Previous Owner | Welch George E | $135,000 |
Source: Public Records
Tax History Compared to Growth
Tax History
| Year | Tax Paid | Tax Assessment Tax Assessment Total Assessment is a certain percentage of the fair market value that is determined by local assessors to be the total taxable value of land and additions on the property. | Land | Improvement |
|---|---|---|---|---|
| 2025 | $5,362 | $627,900 | $330,800 | $297,100 |
| 2024 | $4,774 | $592,300 | $315,000 | $277,300 |
| 2023 | $4,801 | $551,800 | $286,400 | $265,400 |
| 2022 | $4,608 | $493,400 | $249,100 | $244,300 |
| 2021 | $4,246 | $455,100 | $237,200 | $217,900 |
| 2020 | $4,229 | $453,800 | $237,200 | $216,600 |
| 2019 | $4,158 | $437,700 | $225,900 | $211,800 |
| 2018 | $3,910 | $395,300 | $207,300 | $188,000 |
| 2017 | $3,712 | $373,400 | $197,400 | $176,000 |
| 2016 | $3,542 | $352,400 | $184,500 | $167,900 |
| 2015 | $3,407 | $335,000 | $172,400 | $162,600 |
| 2014 | $3,330 | $319,000 | $172,400 | $146,600 |
Source: Public Records
Map
Nearby Homes
- 3 Frank St
- 18 Carmen Terrace
- 3 Laurel St
- 18 Central St
- 51 Vernon St
- 35 Grape St
- 13 Fremont St Unit 13
- 18 Gardner Ave
- 1 Boline Place
- 19 Mason Way Unit 75
- 6 Stratton Dr Unit 404
- 6 Stratton Dr Unit 410
- 2 Mason Way Unit 6524
- 6 Mason Way Unit 6324
- 10 Mason Way Unit 61
- 14 Grant Rd
- 69 Eastern Ave
- 571 Washington St
- 2 Archer Dr Unit 1
- 62 Jefferson Ave
- 28 Tremont St
- 45 Nashua St
- 45 Nashua St Unit 3
- 26 Tremont St
- 54 Nashua St
- 56 Nashua St
- 41 Nashua St
- 41 Nashua St Unit 41
- 43 Nashua St
- 58 Nashua St
- 50 Nashua St
- 20 Tremont St
- 23 Tremont St
- 19 Tremont St
- 48 Nashua St
- 48 Nashua St Unit 1
- 48 Nashua St
- 48 Nashua St Unit 3
- 48 Nashua St Unit 2
- 60 Nashua St