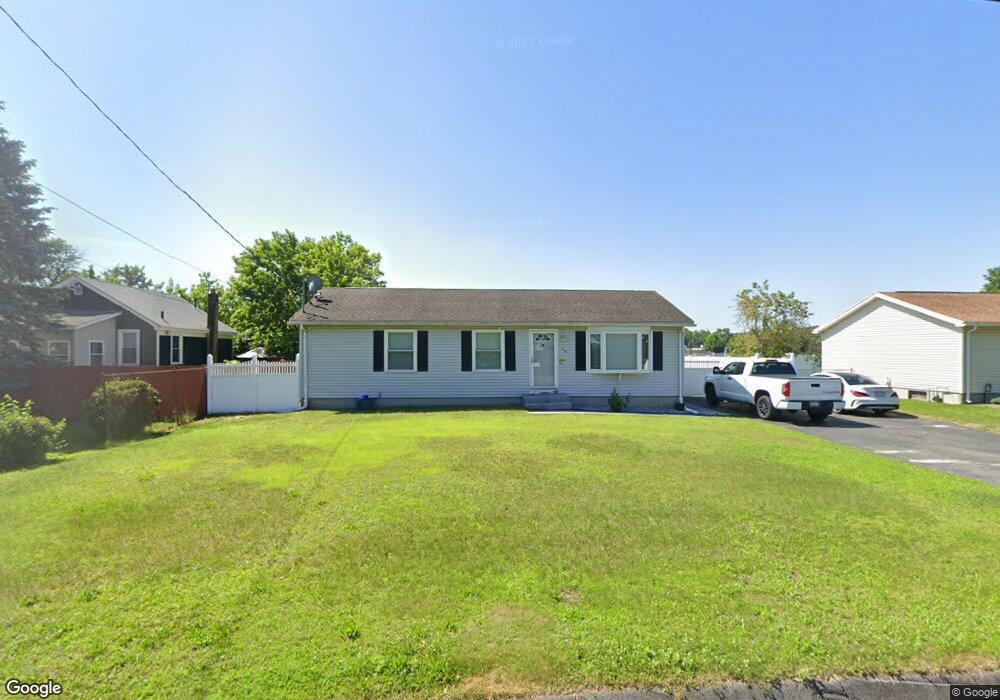
49 Newport St Springfield, MA 01119
Boston Road NeighborhoodEstimated Value: $246,000 - $298,000
About This Home
This home is located at 49 Newport St, Springfield, MA 01119 and is currently estimated at $277,451, approximately $262 per square foot. 49 Newport St is a home located in Hampden County with nearby schools including Frank H. Freedman School, John F. Kennedy Academy, and Springfield Central High School.
Ownership History
We collect this data history from publicly available records. To have your information removed, we recommend requesting removal directly through your county’s website.
Purchase Details
Home Financials for this Owner
Home Financials are based on the most recent Mortgage that was taken out on this home.Home Values in the Area
Average Home Value in this Area
Purchase History
We collect this data history from publicly available records. To have your information removed, we recommend requesting removal directly through your county’s website.
| Date | Buyer | Sale Price | Title Company |
|---|---|---|---|
| $59,900 | -- |
Mortgage History
We collect this data history from publicly available records. To have your information removed, we recommend requesting removal directly through your county’s website.
| Date | Status | Borrower | Loan Amount |
|---|---|---|---|
| Open | $59,700 |
Tax History
We collect this data history from publicly available records. To have your information removed, we recommend requesting removal directly through your county’s website.
| Year | Tax Paid | Tax Assessment Tax Assessment Total Assessment is a certain percentage of the fair market value that is determined by local assessors to be the total taxable value of land and additions on the property. | Land | Improvement |
|---|---|---|---|---|
| 2025 | $2,942 | $187,600 | $45,200 | $142,400 |
| 2024 | $2,896 | $180,300 | $42,300 | $138,000 |
| 2023 | $2,825 | $165,700 | $40,300 | $125,400 |
| 2022 | $2,659 | $141,300 | $40,300 | $101,000 |
| 2021 | $2,648 | $140,100 | $36,600 | $103,500 |
| 2020 | $2,344 | $120,000 | $36,600 | $83,400 |
| 2019 | $2,259 | $114,800 | $36,600 | $78,200 |
| 2018 | $2,186 | $111,100 | $36,600 | $74,500 |
| 2017 | $2,194 | $111,600 | $36,600 | $75,000 |
| 2016 | $2,119 | $107,800 | $36,600 | $71,200 |
| 2015 | $2,150 | $109,300 | $36,600 | $72,700 |
Map
- 108 Barre St
- 12 Angelo St
- 7 Brandon Ave
- 39 Wallace St
- - Glenwood St
- 0 Barnard Ct (Es)
- 63 Hope St
- 70 Shumway St Unit 29
- 11 Lamplighter Ln
- 22 Contessa Dr
- 16 Mobile Home Way
- 16 Pioneer Way
- 40 Better Way
- 57 Tavistock St
- 501 Berkshire Ave
- 44 Harding St
- 19 Annies Way
- 266 Christopher Dr
- 93 Moss Rd
- 28 Northway Dr
Ask me questions while you tour the home.