49 Oak Hill Colony Unit 1 Fox Lake, IL 60020
Northeast Fox Lake NeighborhoodEstimated Value: $108,400 - $158,000
2
Beds
1
Bath
753
Sq Ft
$168/Sq Ft
Est. Value
About This Home
This home is located at 49 Oak Hill Colony Unit 1, Fox Lake, IL 60020 and is currently estimated at $126,600, approximately $168 per square foot. 49 Oak Hill Colony Unit 1 is a home located in Lake County with nearby schools including Lotus Elementary School, Stanton Middle School, and Grant Community High School.
Ownership History
Date
Name
Owned For
Owner Type
Purchase Details
Closed on
Sep 22, 2006
Sold by
Pritz Gregory J and Pritz Nancy Fredian
Bought by
Pakus Steven and Pakus Kim
Current Estimated Value
Home Financials for this Owner
Home Financials are based on the most recent Mortgage that was taken out on this home.
Original Mortgage
$79,000
Outstanding Balance
$6,820
Interest Rate
6.49%
Estimated Equity
$119,780
Purchase Details
Closed on
Aug 12, 2004
Sold by
Brell Sean
Bought by
Pritz Gregory J and Pritz Nancy Fredian
Purchase Details
Closed on
Aug 1, 2000
Sold by
Sherman Robert and Sherman Ruth
Bought by
Brell Sean
Home Financials for this Owner
Home Financials are based on the most recent Mortgage that was taken out on this home.
Original Mortgage
$55,500
Interest Rate
8.24%
Create a Home Valuation Report for This Property
The Home Valuation Report is an in-depth analysis detailing your home's value as well as a comparison with similar homes in the area
Home Values in the Area
Average Home Value in this Area
Purchase History
| Date | Buyer | Sale Price | Title Company |
|---|---|---|---|
| Pakus Steven | $99,000 | First American Title | |
| Pritz Gregory J | $92,000 | Old Republic National Title | |
| Brell Sean | $58,500 | -- |
Source: Public Records
Mortgage History
| Date | Status | Borrower | Loan Amount |
|---|---|---|---|
| Open | Pakus Steven | $79,000 | |
| Previous Owner | Brell Sean | $55,500 |
Source: Public Records
Tax History Compared to Growth
Tax History
| Year | Tax Paid | Tax Assessment Tax Assessment Total Assessment is a certain percentage of the fair market value that is determined by local assessors to be the total taxable value of land and additions on the property. | Land | Improvement |
|---|---|---|---|---|
| 2024 | $2,351 | $30,222 | $3,803 | $26,419 |
| 2023 | $1,931 | $27,061 | $3,405 | $23,656 |
| 2022 | $1,931 | $21,439 | $3,974 | $17,465 |
| 2021 | $1,855 | $20,005 | $3,708 | $16,297 |
| 2020 | $1,833 | $19,453 | $3,606 | $15,847 |
| 2019 | $1,745 | $18,602 | $3,448 | $15,154 |
| 2018 | $1,255 | $13,062 | $1,863 | $11,199 |
| 2017 | $1,245 | $12,433 | $1,773 | $10,660 |
| 2016 | $1,326 | $16,075 | $1,711 | $14,364 |
| 2015 | $1,765 | $15,666 | $1,667 | $13,999 |
| 2014 | $2,546 | $22,701 | $2,581 | $20,120 |
| 2012 | $2,452 | $23,761 | $2,581 | $21,180 |
Source: Public Records
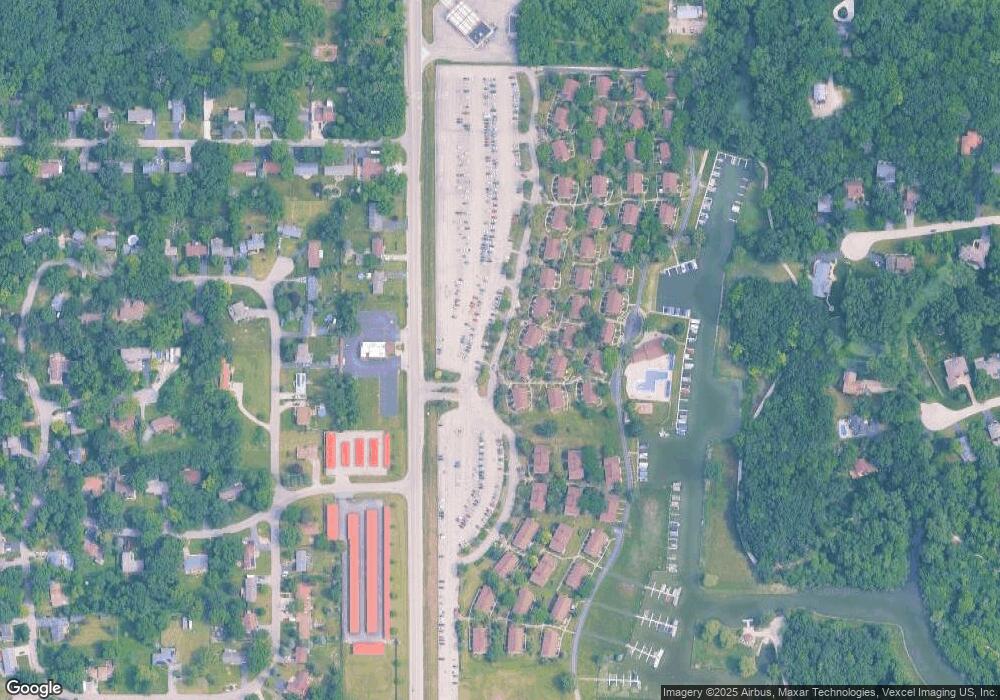
Map
Nearby Homes
- 59 Vail Colony Unit 3
- 13 Saint Thomas Colony Unit 7
- 53 Oak Hill Colony Unit 6
- 40 Bermuda Colony Unit 7
- 16 Saint Thomas Colony Unit 6
- 61 Aspen Colony Unit 2
- 7103 Hidden Green Cir
- 38265 N State Park Rd
- 6415 N Shore Ave
- 38236 N Lee Ave
- 7216 Oxford Cir Unit 230
- 530 Main Street Rd
- 7108 Granada Ln Unit 280
- 28624 W Kendall Ave
- 7411 Leisure Village Ave Unit 198
- 535 Deer Run
- 7314 Chevy Chase Ct Unit 55
- 7415 Clarendon Ct Unit 69
- 38480 N 6th Ave
- 37714 N Nippersink Place
- 49 Oak Hill Colony Unit 9
- 49 Oak Hill Colony Unit 8
- 49 Oak Hill Colony Unit 6
- 49 Oak Hill Colony Unit 5
- 49 Oak Hill Colony Unit 4
- 49 Oak Hill Colony Unit 3
- 49 Oak Hill Colony Unit 2
- 49 Oak Hill Colony Unit 10
- 48 Oak Hill Colony Unit 12
- 48 Oak Hill Colony Unit 9
- 48 Oak Hill Colony Unit 8
- 48 Oak Hill Colony Unit 7
- 48 Oak Hill Colony Unit 6
- 48 Oak Hill Colony Unit 5
- 48 Oak Hill Colony Unit 4
- 48 Oak Hill Colony Unit 3
- 48 Oak Hill Colony Unit 2
- 48 Oak Hill Colony Unit 1
- 486 Oak Hill Colony Unit 6
- 48 Oak Hill Colony Unit 11