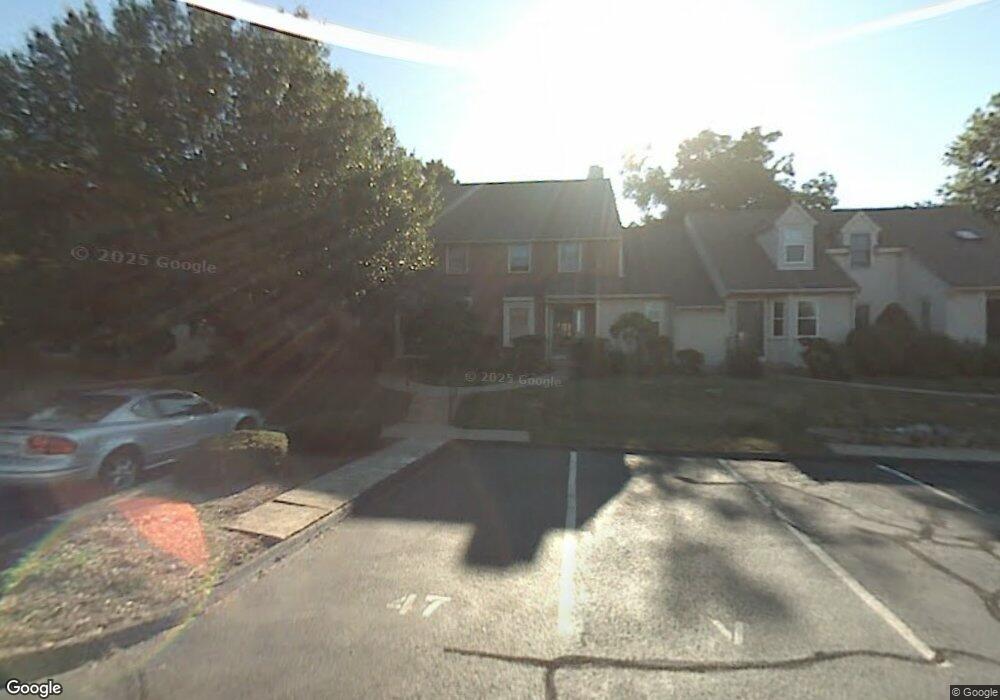
49 Orchard Brook Dr Wethersfield, CT 06109
Estimated Value: $283,000 - $322,000
2
Beds
2
Baths
1,241
Sq Ft
$249/Sq Ft
Est. Value
About This Home
This home is located at 49 Orchard Brook Dr, Wethersfield, CT 06109 and is currently estimated at $308,737, approximately $248 per square foot. 49 Orchard Brook Dr is a home located in Hartford County with nearby schools including Samuel B. Webb Elementary School, Silas Deane Middle School, and Wethersfield High School.
Ownership History
Date
Name
Owned For
Owner Type
Purchase Details
Closed on
Sep 10, 2018
Sold by
Desoo Joseph A
Bought by
Giovanetti Michael
Current Estimated Value
Purchase Details
Closed on
Nov 1, 2012
Sold by
Grabowski Jeffrey D and Garibaldi Amanda L
Bought by
Desopo Joseph A
Home Financials for this Owner
Home Financials are based on the most recent Mortgage that was taken out on this home.
Original Mortgage
$100,000
Interest Rate
3.5%
Purchase Details
Closed on
Dec 1, 2006
Sold by
Pentalow Tracy
Bought by
Gradbowski Jeffrey D and Garibaldi Amanda L
Home Financials for this Owner
Home Financials are based on the most recent Mortgage that was taken out on this home.
Original Mortgage
$168,000
Interest Rate
6.36%
Purchase Details
Closed on
Aug 16, 1999
Sold by
Gagnon John A and Gagnon Masciovecchio P
Bought by
Pentalou Tracy
Create a Home Valuation Report for This Property
The Home Valuation Report is an in-depth analysis detailing your home's value as well as a comparison with similar homes in the area
Home Values in the Area
Average Home Value in this Area
Purchase History
| Date | Buyer | Sale Price | Title Company |
|---|---|---|---|
| Giovanetti Michael | $167,500 | -- | |
| Desopo Joseph A | $170,000 | -- | |
| Gradbowski Jeffrey D | $210,000 | -- | |
| Pentalou Tracy | $115,000 | -- |
Source: Public Records
Mortgage History
| Date | Status | Borrower | Loan Amount |
|---|---|---|---|
| Previous Owner | Pentalou Tracy | $100,000 | |
| Previous Owner | Pentalou Tracy | $168,000 | |
| Previous Owner | Pentalou Tracy | $21,000 | |
| Previous Owner | Pentalou Tracy | $83,000 |
Source: Public Records
Tax History
| Year | Tax Paid | Tax Assessment Tax Assessment Total Assessment is a certain percentage of the fair market value that is determined by local assessors to be the total taxable value of land and additions on the property. | Land | Improvement |
|---|---|---|---|---|
| 2025 | $6,705 | $162,660 | $0 | $162,660 |
| 2024 | $5,048 | $116,790 | $0 | $116,790 |
| 2023 | $4,879 | $116,790 | $0 | $116,790 |
| 2022 | $4,798 | $116,790 | $0 | $116,790 |
| 2021 | $4,750 | $116,790 | $0 | $116,790 |
| 2020 | $4,752 | $116,790 | $0 | $116,790 |
| 2019 | $4,758 | $116,790 | $0 | $116,790 |
| 2018 | $4,759 | $116,700 | $0 | $116,700 |
| 2017 | $4,641 | $116,700 | $0 | $116,700 |
| 2016 | $4,498 | $116,700 | $0 | $116,700 |
| 2015 | $4,457 | $116,700 | $0 | $116,700 |
| 2014 | $4,288 | $116,700 | $0 | $116,700 |
Source: Public Records
Map
Nearby Homes
- 7 Barrington Dr Unit C
- 62 Harold Dr
- 274 Cedarwood Ln
- 76 Luca Lane Homesite 8
- 138 Cypress Rd Unit 138
- 61 Luca Ln
- 101 Collier Rd
- 0 Collier Rd
- 6 Vinnie Dr
- 5 Robeth Ln
- 5 Westmont Rd
- 35 Kingston St
- 38 Northwood Rd
- 20 Forest Dr
- 129 Goff Rd
- 17 Whiteside St
- 631 Churchill Dr
- 15 Woodsedge Dr Unit 5C
- 35 Woodsedge Dr Unit 4C
- 155 Old Common Rd
- 50 Orchard Brook Dr
- 48 Orchard Brook Dr
- 47 Orchard Brook Dr
- 46 Orchard Brook Dr
- 45 Orchard Brook Dr
- 44 Orchard Brook Dr
- 43 Orchard Brook Dr
- 42 Orchard Brook Dr
- 41 Orchard Brook Dr
- 40 Orchard Brook Dr
- 39 Orchard Brook Dr
- 38 Orchard Brook Dr
- 37 Orchard Brook Dr
- 36 Orchard Brook Dr
- 35 Orchard Brook Dr
- 34 Orchard Brook Dr
- 33 Orchard Brook Dr
- 32 Orchard Brook Dr
- 31 Orchard Brook Dr
- 30 Orchard Brook Dr
Your Personal Tour Guide
Ask me questions while you tour the home.